本系列文章配套代码获取有以下两种途径:
-
通过百度网盘获取:
链接:https://pan.baidu.com/s/1W26KrZK7RjwgxvulccTA9w?pwd=mnsj提取码:mnsj
-
前往GitHub获取:
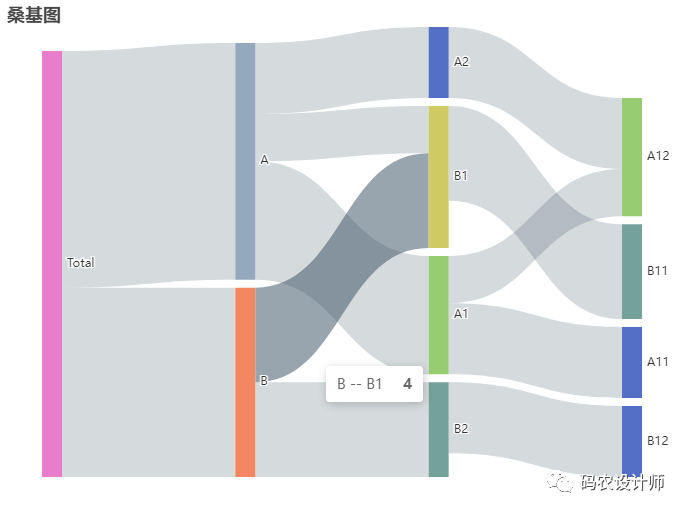
https://github.com/returu/Data_Visualization在ECharts中绘制桑基图,需要将series中的type设置为"sankey",另外需要在data(nodes)中定义桑基图节点数据以及在links(edges)中节点间边的信息。
需要注意: 桑基图理论上只支持有向无环图(DAG, Directed Acyclic Graph),所以请确保输入的边是无环的。
例如,通过以下代码,就可以生成一个简单的桑基图:
 1    // 设置图表的参数
 2    var option = {
 3        title: {
 4            text: "桑基图",
 5        },
 6
 7        tooltip: {},
 8
 9        // 数据系列
10        series: [{
11            name: "系列1",
12            type: "sankey",
13
14            // 桑基图节点数据列表
15            data: [{
16                    name: 'Total'
17                },{
18                    name: 'A'
19                },{
20                    name: 'B'
21                },{
22                    name: 'A1'
23                }, {
24                    name: 'A2'
25                },{
26                    name: 'B1'
27                },{
28                    name: 'B2'
29                },{
30                    name: 'A11'
31                },{
32                    name: 'A12'
33                },{
34                    name: 'B11'
35                },{
36                    name: 'B12'
37                },
38            ],
39
40            // 节点间的边
41            links: [{
42                    source: 'Total',
43                    target: 'A',
44                    value: 10
45                },{
46                    source: 'Total',
47                    target: 'B',
48                    value: 8
49                },{
50                    source: 'A',
51                    target: 'A1',
52                    value: 5
53                },{
54                    source: 'A',
55                    target: 'A2',
56                    value: 3
57                },{
58                    source: 'A',
59                    target: 'B1',
60                    value: 2
61                },{
62                    source: 'B',
63                    target: 'B1',
64                    value: 4
65                },{
66                    source: 'B',
67                    target: 'B2',
68                    value: 4
69                },{
70                    source: 'A1',
71                    target: 'A11',
72                    value: 3
73                },{
74                    source: 'A1',
75                    target: 'A12',
76                    value: 2
77                },{
78                    source: 'A2',
79                    target: 'A12',
80                    value: 3
81                },{
82                    source: 'B1',
83                    target: 'B11',
84                    value: 4
85                },{
86                    source: 'B2',
87                    target: 'B12',
88                    value: 3
89                },
90            ],
91        }],
92    };
可视化结果如下图所示:

自定义层级样式:
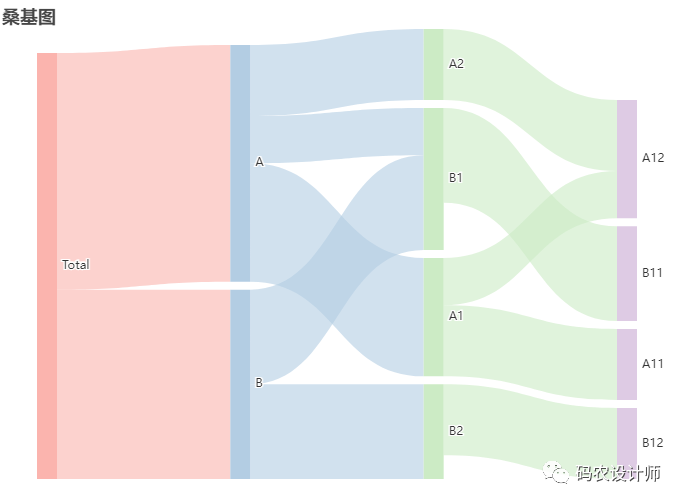
可以通过data中的depth参数指定节点所在的层(取值从 0 开始),然后通过levels对桑基图的每一层进行单独设置。
代码如下所示:
  1    // 设置图表的参数
  2    var option = {
  3        title: {
  4            text: "桑基图",
  5        },
  6
  7        tooltip: {},
  8
  9        // 数据系列
 10        series: [{
 11            name: "系列1",
 12            type: "sankey",
 13
 14            // 桑基图节点数据列表
 15            data: [{
 16                name: 'Total'
 17            }, {
 18                name: 'A'
 19            }, {
 20                name: 'B'
 21            }, {
 22                name: 'A1'
 23            }, {
 24                name: 'A2'
 25            }, {
 26                name: 'B1'
 27            }, {
 28                name: 'B2'
 29            }, {
 30                name: 'A11'
 31            }, {
 32                name: 'A12'
 33            }, {
 34                name: 'B11'
 35            }, {
 36                name: 'B12'
 37            }, ],
 38
 39            levels: [{
 40                    depth: 0,
 41                    itemStyle: {
 42                        color: '#fbb4ae'
 43                    },
 44                    lineStyle: {
 45                        color: 'source',
 46                        opacity: 0.6
 47                    }
 48                },
 49                {
 50                    depth: 1,
 51                    itemStyle: {
 52                        color: '#b3cde3'
 53                    },
 54                    lineStyle: {
 55                        color: 'source',
 56                        opacity: 0.6
 57                    }
 58                },
 59                {
 60                    depth: 2,
 61                    itemStyle: {
 62                        color: '#ccebc5'
 63                    },
 64                    lineStyle: {
 65                        color: 'source',
 66                        opacity: 0.6
 67                    }
 68                },
 69                {
 70                    depth: 3,
 71                    itemStyle: {
 72                        color: '#decbe4'
 73                    },
 74                    lineStyle: {
 75                        color: 'source',
 76                        opacity: 0.6
 77                    }
 78                }
 79            ],
 80
 81            // 节点间的边
 82            links: [{
 83                source: 'Total',
 84                target: 'A',
 85                value: 10
 86            }, {
 87                source: 'Total',
 88                target: 'B',
 89                value: 8
 90            }, {
 91                source: 'A',
 92                target: 'A1',
 93                value: 5
 94            }, {
 95                source: 'A',
 96                target: 'A2',
 97                value: 3
 98            }, {
 99                source: 'A',
100                target: 'B1',
101                value: 2
102            }, {
103                source: 'B',
104                target: 'B1',
105                value: 4
106            }, {
107                source: 'B',
108                target: 'B2',
109                value: 4
110            }, {
111                source: 'A1',
112                target: 'A11',
113                value: 3
114            }, {
115                source: 'A1',
116                target: 'A12',
117                value: 2
118            }, {
119                source: 'A2',
120                target: 'A12',
121                value: 3
122            }, {
123                source: 'B1',
124                target: 'B11',
125                value: 4
126            }, {
127                source: 'B2',
128                target: 'B12',
129                value: 3
130            }, ],
131        }],
132    };
可视化结果如下图所示:

另外,可以通过label设置描述每个矩形节点中文本标签的样式,通过itemStyle设置桑基图节点矩形的样式、通过lineStyle设置桑基图边的样式,设置方式与之前图表类似,这里就不做详细介绍。
更多参数和配置可以查看官方文档:
1https://echarts.apache.org/zh/option.html


本篇文章来源于微信公众号: 码农设计师
