本系列文章配套代码获取有以下两种途径:
-
通过百度网盘获取:
链接:https://pan.baidu.com/s/1W26KrZK7RjwgxvulccTA9w?pwd=mnsj提取码:mnsj
-
前往GitHub获取:
https://github.com/returu/Data_Visualization-
定制文本块整体的样式(如背景、边框、阴影等)、位置、旋转等。 -
对文本块中个别片段定义样式(如颜色、字体、高宽、背景、阴影等)、对齐方式等。 -
在文本中使用图片做小图标或者背景。 -
特定组合以上的规则,可以做出简单表格、分割线等效果。
首先要了解以下两个名词的含义:
-
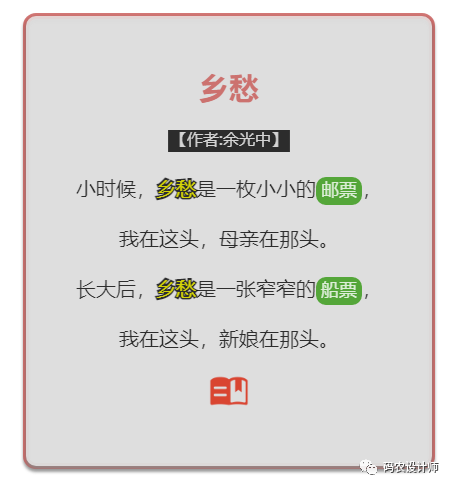
文本块(Text Block):文本标签块整体。例如,上面的示例中,红边灰底以及诗歌正文中黑色文字部分为文本块样式。 -
文本片段(Text fragment):文本标签块中的部分文本。例如,上面的示例中,标题+作者+诗歌正文中四处文字+底部的图片均为文本片段样式。在文本中对可以对部分文本采用在rich属性(例如series-bar.label.rich)中定义的文本片段样式。但是需要在formatter配置项下使用{styleName|text content text content}的方式来标记样式名,换行需要使用‘n’。
-
字体基本样式设置:fontStyle、fontWeight、fontSize、fontFamily。 -
文字颜色:color。 -
文字描边:textBorderColor、textBorderWidth。 -
文字阴影:textShadowColor、textShadowBlur、textShadowOffsetX、textShadowOffsetY。 -
文本块或文本片段大小:lineHeight、width、height、padding。 -
文本块或文本片段的对齐:align、verticalAlign。 -
文本块或文本片段的边框、背景(颜色或图片):backgroundColor、borderColor、borderWidth、borderRadius。 -
文本块或文本片段的阴影:shadowColor、shadowBlur、shadowOffsetX、shadowOffsetY。 -
文本块的位置和旋转:position、distance、rotate。
实现上述示例的代码如下所示:
 1    // 设置图表的参数
 2    var option = {
 3        // 数据系列
 4        series: [{
 5            type: 'scatter',
 6            data: [
 7                [0, 0]
 8            ],
 9            symbolSize: 1,
10            label: {
11                show: true,
12                // 在文本中,可以对部分文本采用 rich 中定义样式。
13                // 需要在文本中使用`{styleName|text content text content}` 标记样式名。
14                // 注意,换行需要使用 'n'。
15                formatter: [
16                    '{title|乡愁}',
17                    '{author|【作者:余光中】}',
18                    '小时候,{fragment1|乡愁}是一枚小小的{fragment2|邮票},',
19                    '我在这头,母亲在那头。',
20                    '长大后,{fragment1|乡愁}是一张窄窄的{fragment2|船票},',
21                    '我在这头,新娘在那头。',
22                    '{fragment3|}',
23                ].join('n'),
24
25                // 文本块(Text Block)的样式
26                align: 'center', // 文字水平对齐方式
27                backgroundColor: '#eee', // 文字块背景色
28                borderColor: 'rgb(199,86,83)', // 文字块边框颜色
29                borderWidth: 3, // 文字块边框宽度
30                borderRadius: 10, // 文字块的圆角
31                padding: 50, // 文字块的内边距
32                color: '#000', // 文字的颜色
33                fontSize: 20, // 文字的字体大小
34                shadowBlur: 3, // 文字块的背景阴影长度
35                shadowColor: '#888', // 文字块的背景阴影颜色
36                shadowOffsetX: 0, // 文字块的背景阴影 X 偏移
37                shadowOffsetY: 3, // 文字块的背景阴影 Y 偏移
38                lineHeight: 50, // 行高
39
40                // 各个文本片段(Text fragment)的样式
41                rich: {
42                    title: {
43                        fontSize: 30, // 文字的字体大小
44                        align: 'center', // 文字水平对齐方式
45                        fontWeight: 'bold', // 文字字体的粗细
46                        color: 'rgb(199,86,83)', // 文字的颜色
47                    },
48                    author: {
49                        fontSize: 16, // 文字的字体大小
50                        align: 'center', // 文字水平对齐方式
51                        backgroundColor: '#000', // 文字块背景色
52                        color: 'white', // 文字的颜色
53                        padding: 3 // 文字块的圆角
54                    },
55                    fragment1: {
56                        fontSize: 20, // 文字的字体大小
57                        textBorderColor: '#000', // 文字本身的描边颜色
58                        textBorderWidth: 3, // 文字本身的描边宽度
59                        color: '#ff0' // 文字的颜色
60                    },
61                    fragment2: {
62                        fontSize: 18, // 文字的字体大小
63                        backgroundColor: '#339911', // 文字块背景色
64                        color: '#fff', // 文字的颜色
65                        borderRadius: 10, // 文字块的圆角
66                        padding: 5 // 文字块的内边距
67                    },
68                    fragment3: {
69                        width: 40, // 文字块的宽度。一般不用指定,不指定则自动是文字的宽度。在想做表格项或者使用图片时,可能会使用它
70                        height: 40, // 文字块的高度
71                        backgroundColor: {
72                            image: './images/icon.png', // 图片路径
73                        },
74                    },
75                }
76            }
77        }],
78        xAxis: {
79            axisLabel: { show: false },
80            axisLine: { show: false },
81            splitLine: { show: false },
82            axisTick: { show: false },
83            min: -1,
84            max: 1
85        },
86        yAxis: {
87            axisLabel: { show: false },
88            axisLine: { show: false },
89            splitLine: { show: false },
90            axisTick: { show: false },
91            min: -1,
92            max: 1
93        }
94 };介绍完如何使用富文本标签后,本次将在基础柱状图的基础上,在Y轴类别处添加图标、在。
可视化效果如下图所示:
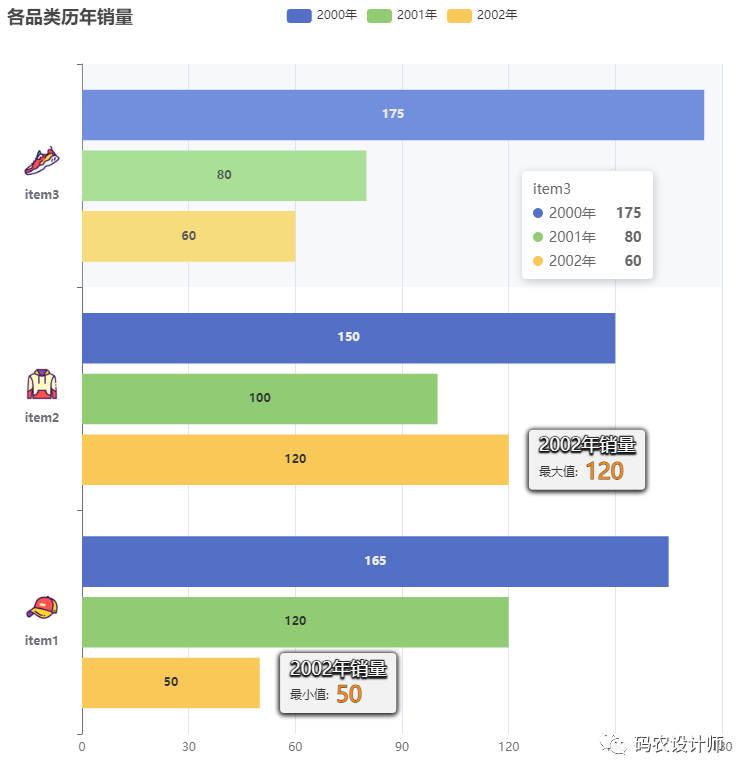
可以通过以下步骤实现上述效果:
首先实现简单的柱状图,需要注意的是本次定义了一个Label变量用于设置统一的标签样式,以便后续方便重复使用;
在yAxis.axisLabel配置项下定义富文本标签样式,用于在Y轴添加图标;
在series.markPoint.label配置项下定义在图表标注中使用的富文本标签样式;
代码如下所示:
  1    // 设置统一的标签样式,以便后续方便重复使用
  2    var Label = {
  3        show: true, // 是否显示标签
  4        position: "inside", // 标签的位置
  5        fontWeight: "bold", // 文字字体的粗细
  6        fontFamily: "Microsoft YaHei", // 文字的字体系列
  7    };
  8
  9    // 定义图标本地路径
 10    var itemIcons = {
 11        item1: './images/item1.png',
 12        item2: './images/item2.png',
 13        item3: './images/item3.png'
 14    };
 15
 16    // 设置图表的参数
 17    var option = {
 18        title: {
 19            text: "各品类历年销量"
 20        },
 21
 22        tooltip: {
 23            trigger: 'axis', // 触发类型,axis为坐标轴触发,主要在柱状图,折线图等会使用类目轴的图表中使用
 24            axisPointer: { // 坐标轴指示器配置项
 25                type: 'shadow' // 指示器类型,shadow为阴影指示器
 26            }
 27        },
 28
 29        // 图例
 30        legend: {},
 31
 32        // x轴
 33        xAxis: {
 34            type: 'value',
 35        },
 36
 37        // y轴
 38        yAxis: {
 39            type: 'category',
 40            data: ['item1', 'item2', 'item3'],
 41            // 使用富文本标签
 42            axisLabel: {
 43                formatter: function(value) {
 44                    // return '{value|' + value + '}n{' + value + '| }'; // 此时文字在上,图片在下
 45                    return '{' + value + '| }n{value|' + value + '}'; // 此时图片在上,文字在下
 46                },
 47                margin: 20,
 48                rich: {
 49                    value: {
 50                        lineHeight: 30,
 51                        align: 'center',
 52                        fontWeight: "bold", // 文字字体的粗细
 53                        fontFamily: "Microsoft YaHei", // 文字的字体系列
 54                    },
 55                    item1: {
 56                        height: 40,
 57                        align: 'center',
 58                        backgroundColor: { image: itemIcons.item1 }
 59                    },
 60                    item2: {
 61                        height: 40,
 62                        align: 'center',
 63                        backgroundColor: { image: itemIcons.item2 }
 64                    },
 65                    item3: {
 66                        height: 40,
 67                        align: 'center',
 68                        backgroundColor: { image: itemIcons.item3 }
 69                    }
 70                }
 71            },
 72        },
 73
 74        // 数据系列
 75        series: [{
 76            name: '2000年',
 77            type: 'bar',
 78            label: Label, // 使用统一的标签样式
 79            data: [165, 150, 175]
 80        }, {
 81            name: '2001年',
 82            type: 'bar',
 83            label: Label, // 使用统一的标签样式
 84            data: [120, 100, 80]
 85        }, {
 86            name: '2002年',
 87            type: 'bar',
 88            data: [50, 120, 60],
 89            label: Label, // 使用统一的标签样式
 90            // 图表标注
 91            markPoint: {
 92                symbolSize: 1,
 93                symbolOffset: [0, '50%'],
 94                // 标注的文本
 95                label: {
 96                    // 标签内容格式器,支持字符串模板和回调函数两种形式
 97                    // {b}:数据名、{c}:数据值
 98                    formatter: '{style1|2002年销量n}{style2|{b} }{style3|{c}}',
 99                    backgroundColor: 'rgb(242,242,242)',
100                    borderColor: '#aaa',
101                    borderWidth: 1,
102                    borderRadius: 4,
103                    padding: [4, 10],
104                    lineHeight: 26,
105                    shadowBlur: 5,
106                    shadowColor: '#000',
107                    shadowOffsetX: 0,
108                    shadowOffsetY: 1,
109                    position: 'right',
110                    distance: 20,
111                    // 各个文本片段(Text fragment)的样式
112                    rich: {
113                        style1: {
114                            align: 'center',
115                            color: '#fff',
116                            fontSize: 18,
117                            textShadowBlur: 2,
118                            textShadowColor: '#000',
119                            textShadowOffsetX: 0,
120                            textShadowOffsetY: 1,
121                            textBorderColor: '#333',
122                            textBorderWidth: 2
123                        },
124                        style2: {
125                            color: '#333'
126                        },
127                        style3: {
128                            color: '#ff8811',
129                            textBorderColor: '#000',
130                            textBorderWidth: 1,
131                            fontSize: 22
132                        }
133                    }
134                },
135                // 标注的数据数组
136                // 直接用 type 属性标注系列中的最大值,最小值
137                data: [
138                    { type: 'max', name: '最大值: ' },
139                    { type: 'min', name: '最小值: ' },
140                ]
141            }
142        }]
143    };
更多参数和配置可以查看官方文档:
1https://echarts.apache.org/zh/option.html

本篇文章来源于微信公众号: 码农设计师