本系列文章是根据GeoPandas官方文档翻译整理,学习任何一个Python第三方库,其官方文档都是最好的学习资料。相比网络搜索得到的一些资料,官方文档是权威的一手资料,其内容全面、准确可靠。通过官方文档入手,能够保证学习认知不会有大偏差。在学习完官方文档后,可以在寻找其他资料进一步学习。
点击“阅读原文”或者直接访问下方链接,查看翻译整理的“GeoPandas 0.12.2 中文文档”。
https://www.mizhushare.com/docs-
可以通过百度网盘获取,需要在本地配置代码运行环境:
链接:https://pan.baidu.com/s/185Qs6RpVhyP2nm9VV39Ehw?pwd=mnsj提取码:mnsj
-
前往GitHub详情页面,单击 code 按钮,选择Download ZIP选项:
https://github.com/returu/geopandasGeoPandas中制作多层地图有两种策略——一种更简洁,另一种更灵活。需要注意的是,在绘图之前,需要确保共享一个共同的CRS(以便对齐)。
仍以world数据集为例:
首先加载数据并查看数据的CRS:
 1>>> world = gpd.read_file('./datasets/naturalearth_lowres/naturalearth_lowres.shp')
 2>>> world = world[world.name!="Antarctica"] # 删除南极洲
 3>>> cities = gpd.read_file('./datasets/naturalearth_cities/naturalearth_cities.shp')
 4
 5# 查看CRS
 6>>> world.crs
 7
 8<Geographic 2D CRS: EPSG:4326>
 9Name: WGS 84
10Axis Info [ellipsoidal]:
11- Lat[north]: Geodetic latitude (degree)
12- Lon[east]: Geodetic longitude (degree)
13Area of Use:
14- name: World.
15- bounds: (-180.0, -90.0, 180.0, 90.0)
16Datum: World Geodetic System 1984 ensemble
17- Ellipsoid: WGS 84
18- Prime Meridian: Greenwich
19
20>>> cities.crs
21
22<Geographic 2D CRS: EPSG:4326>
23Name: WGS 84
24Axis Info [ellipsoidal]:
25- Lat[north]: Geodetic latitude (degree)
26- Lon[east]: Geodetic longitude (degree)
27Area of Use:
28- name: World.
29- bounds: (-180.0, -90.0, 180.0, 90.0)
30Datum: World Geodetic System 1984 ensemble
31- Ellipsoid: WGS 84
32- Prime Meridian: Greenwich
绘图:
GeoPandas中制作多层地图有以下两种方法:
-
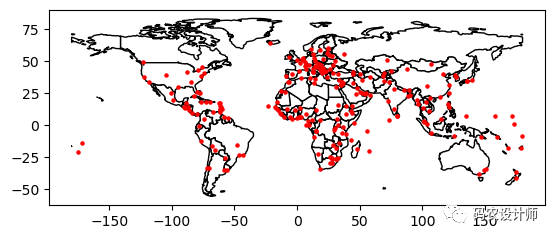
方法一:
1>>> base = world.plot(color='white', edgecolor='black')
2>>> cities.plot(ax=base, marker='o', color='red', markersize=5)
-
方法二(使用matplotlib对象):
 1>>> import matplotlib.pyplot as plt
 2
 3>>> fig , ax = plt.subplots()
 4
 5>>> ax.set_aspect(aspect="equal")
 6
 7>>> world.plot(ax=ax , color='white' , edgecolor='black')
 8
 9>>> cities.plot(ax=ax, marker='o', color='red', markersize=5)
10
11>>> plt.show()
两种方法的绘图结果一致,如下图所示:

控制图层顺序:
绘制多层时,基于默认顺序,先绘制的几何图形位于下方。
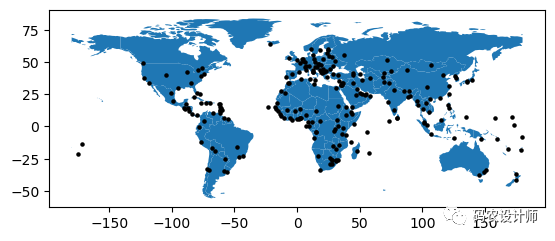
例如,下面的示例中,基于默认顺序,城市(点)将绘制在世界(多边形)下方。
1>>> ax = cities.plot(color='k', markersize=5 )
2>>> world.plot(ax=ax)
绘图结果如下图所示:

可以使用 zorder 来控制绘制图层的顺序。zorder 值越低,图层在地图上越处于底层,反之亦然。
上面的示例中,我们可以将城市的 zorder 设置为高于世界的 zorder 以将其移至顶部。
1>>> ax = cities.plot(zorder=2, color='k', markersize=5 )
2>>> world.plot(ax=ax , zorder=1)
绘图结果如下图所示:


本篇文章来源于微信公众号: 码农设计师
