本系列文章配套代码获取有以下三种途径:
-
可以在以下网站查看,该网站是使用JupyterLite搭建的web端Jupyter环境,因此无需在本地安装运行环境即可使用,首次运行浏览器需要下载一些配置文件(大约20M):
https://returu.github.io/Python_Data_Analysis/lab/index.html-
也可以通过百度网盘获取,需要在本地配置代码运行环境,环境配置可以查看【Python基础】2.搭建Python开发环境:
链接:https://pan.baidu.com/s/1MYkeYeVAIRqbxezQECHwcA?pwd=mnsj提取码:mnsj
-
前往GitHub详情页面,单击 code 按钮,选择Download ZIP选项:
https://github.com/returu/Python_Data_Analysis根据《Python for Data Analysis 3rd Edition》翻译整理
—————————————————–
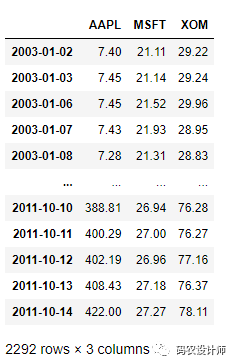
本次依旧使用上篇的历史股票数据。
1>>> stock = pd.read_csv("data/stock.csv",parse_dates=True, index_col=0)
2>>> stock_3 = stock[["AAPL", "MSFT", "XOM"]]
3>>> stock_3 = stock_3.resample("B").ffill()
4>>> stock_3

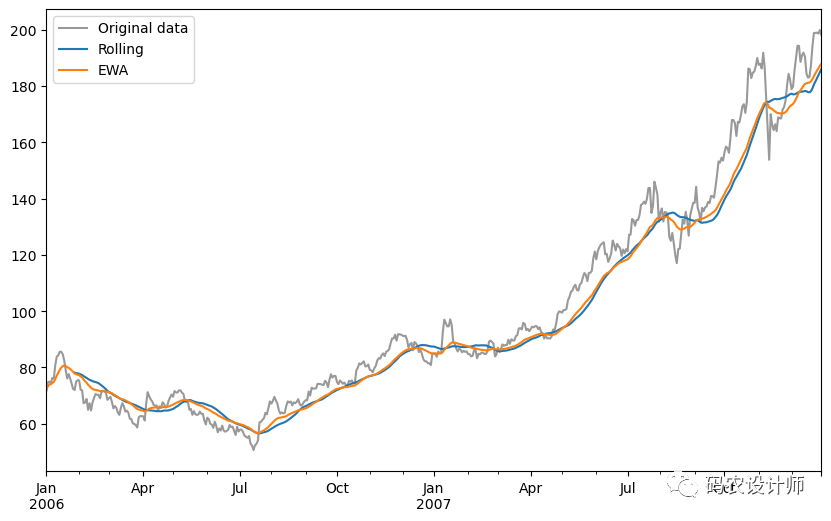
指定一个常数衰减因子以便为更多近期观察值赋予更多权重,可以替代使用具有相同加权观察值的静态窗口大小的方法。由于指数加权统计数据更重视更近期的观察结果,因此与等权重版本相比,它对变化“适应”地更快。
有几种方法可以指定衰减因子。其中,一个流行的方法是使用跨度span,这使得结果与窗口大小等于跨度的简单移动窗口函数。pandas 具有 ewm 算子(代表指数加权移动)。
 1DataFrame.ewm(com=None,
 2              span=None,
 3              halflife=None,
 4              alpha=None,
 5              min_periods=0,
 6              adjust=True,
 7              ignore_na=False,
 8              axis=0,
 9              times=None,
10              method='single')
-
com:根据质心指定衰减, α=1/(1+com), for com≥0;
-
span :根据范围指定衰减, α=2/(span+1), for span≥1;
-
halflife :根据半衰期指定衰;减,
α=1−exp(log(0.5)/halflife),forhalflife>0; -
alpha:直接指定平滑系数α,
0<α≤1; -
min_periods :窗口中具有值的最小观察数;
-
adjust:是否进行误差修正;
-
ignore_na:算权重时忽略缺失值。
 1>>> aapl_px = stock_3["AAPL"]["2006":"2007"]
 2>>> aapl_px
 32006-01-02     71.89
 42006-01-03     74.75
 52006-01-04     74.97
 62006-01-05     74.38
 72006-01-06     76.30
 8               ...
 92007-12-25    198.80
102007-12-26    198.95
112007-12-27    198.57
122007-12-28    199.83
132007-12-31    198.08
14Freq: B, Name: AAPL, Length: 521, dtype: float64
15
16
17>>> ma30 = aapl_px.rolling(30, min_periods=20).mean()
18>>> ma30
192006-01-02           NaN
202006-01-03           NaN
212006-01-04           NaN
222006-01-05           NaN
232006-01-06           NaN
24                 ...
252007-12-25    181.520333
262007-12-26    182.615000
272007-12-27    183.757333
282007-12-28    184.872000
292007-12-31    186.009667
30Freq: B, Name: AAPL, Length: 521, dtype: float64
31
32
33>>> ewma30 = aapl_px.ewm(span=30).mean()
34>>> ewma30
352006-01-02     71.890000
362006-01-03     73.367667
372006-01-04     73.937767
382006-01-05     74.059619
392006-01-06     74.569360
40                 ...
412007-12-25    184.441771
422007-12-26    185.377786
432007-12-27    186.228897
442007-12-28    187.106387
452007-12-31    187.814362
46Freq: B, Name: AAPL, Length: 521, dtype: float64
绘制对比图:
1>>> aapl_px.plot(style="k-", alpha=0.4 ,label="Original data" , figsize=(10,6))
2
3>>> ma30.plot(style="-", label="Rolling")
4
5>>> ewma30.plot(style="-", label="EWA")
6
7>>> plt.legend() # 创建图例

一些统计运算符,如相关性和协方差,需要对两个时间序列进行运算。
例如,金融分析师通常对股票与标准普尔 500 指数等基准指数的相关性感兴趣。为了了解这一点,我们首先计算我们感兴趣的所有时间序列的百分比变化:
 1>>> spx_px = stock["SPX"]
 2>>> spx_px
 32003-01-02     909.03
 42003-01-03     908.59
 52003-01-06     929.01
 62003-01-07     922.93
 72003-01-08     909.93
 8               ...
 92011-10-10    1194.89
102011-10-11    1195.54
112011-10-12    1207.25
122011-10-13    1203.66
132011-10-14    1224.58
14Name: SPX, Length: 2214, dtype: float64
15
16>>> spx_rets = spx_px.pct_change()
17>>> spx_rets
182003-01-02         NaN
192003-01-03   -0.000484
202003-01-06    0.022474
212003-01-07   -0.006545
222003-01-08   -0.014086
23                ...
242011-10-10    0.034125
252011-10-11    0.000544
262011-10-12    0.009795
272011-10-13   -0.002974
282011-10-14    0.017380
29Name: SPX, Length: 2214, dtype: float64
30
31>>> returns = stock_3.pct_change()
32>>> returns
33                AAPL      MSFT       XOM
342003-01-02       NaN       NaN       NaN
352003-01-03  0.006757  0.001421  0.000684
362003-01-06  0.000000  0.017975  0.024624
372003-01-07 -0.002685  0.019052 -0.033712
382003-01-08 -0.020188 -0.028272 -0.004145
39...              ...       ...       ...
402011-10-10  0.051406  0.026286  0.036977
412011-10-11  0.029526  0.002227 -0.000131
422011-10-12  0.004747 -0.001481  0.011669
432011-10-13  0.015515  0.008160 -0.010238
442011-10-14  0.033225  0.003311  0.022784
45
46[2292 rows x 3 columns]
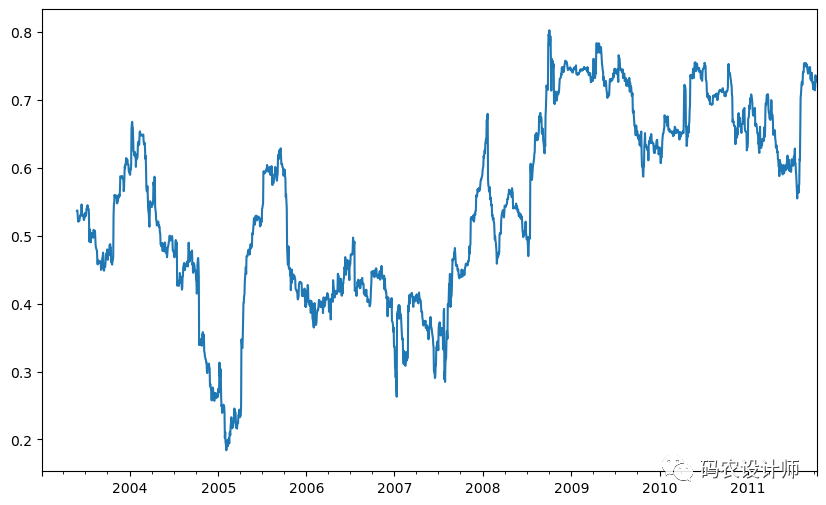
在我们调用rolling之后,corr 聚合函数可以根据 spx_rets 计算滚动相关性:
1>>> corr = returns["AAPL"].rolling(125, min_periods=100).corr(spx_rets)
2
3>>> corr.plot(figsize=(10,6))

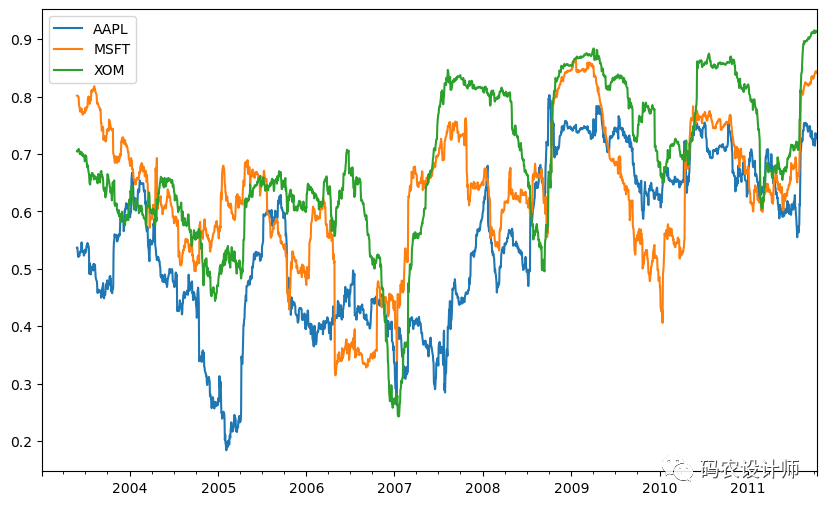
假设您想同时计算标准普尔 500 指数与多只股票的滚动相关性。您可以像上面所做的那样为每只股票编写一个循环来计算它,但是如果每只股票都是单个 DataFrame 中的一列,我们可以通过在 DataFrame 上调用rolling 并传递 spx_rets 来一次计算所有滚动相关性。
1>>> corr = returns.rolling(125, min_periods=100).corr(spx_rets)
2
3>>> corr.plot(figsize=(10,6))

在rolling及其相关方法上使用apply方法,提供了一种在移动窗口中应用你自己设计的数组函数的方法。唯一的要求是,该函数从每个数组中产生一个单值(缩聚)。
例如,尽管我们可以使用rolling(...).quantile(q) 计算样本的分位数,但是我们可能对特定值在样本中的百分位数感兴趣。scipy.stats.percentileofscore 函数就是实现该功能的:
 1# 如果您还没有安装 SciPy,您可以使用 conda 或 pip 安装它:conda install scipy
 2>>> from scipy.stats import percentileofscore
 3
 4>>> def score_at_2percent(x):
 5...     return percentileofscore(x, 0.02)
 6
 7
 8>>> result = returns["AAPL"].rolling(250).apply(score_at_2percent)
 9>>> result
102003-01-02     NaN
112003-01-03     NaN
122003-01-06     NaN
132003-01-07     NaN
142003-01-08     NaN
15              ...
162011-10-10    92.4
172011-10-11    92.0
182011-10-12    92.0
192011-10-13    92.0
202011-10-14    91.6
21Freq: B, Name: AAPL, Length: 2292, dtype: float64
绘图:
1>>> result.plot(figsize=(10,6))

本篇文章来源于微信公众号: 码农设计师
