本系列文章配套代码获取有以下两种途径:
-
通过百度网盘获取:
链接:https://pan.baidu.com/s/1W26KrZK7RjwgxvulccTA9w?pwd=mnsj提取码:mnsj
-
前往GitHub获取:
https://github.com/returu/Data_VisualizationECharts除了上述内置的数据转换器外,也可以使用外部的数据转换器。外部数据转换器能提供或定制更丰富的功能。
例如,使用第三方库ecStat提供的数据转换器可以在数据转换操作中实现直方图、聚类、回归、统计等操作。
因为使用到了第三方库,因此首先需要配置下所需文件。
1https://github.com/ecomfe/echarts-stat/tree/master/dist
引入ecStat.js脚本文件。
1    <!-- 引入下载的 ecStat.js 文件 -->
2    <script type="text/javascript" src="js/ecStat.js"></script>
使用ecStat前需要先注册外部数据转换器,然后在transform中引用注册的数据转换器,下述代码以生成数据的指数回归线为例:
 1// 注册外部数据转换器
 2echarts.registerTransform(ecStat.transform.regression);
 3
 4option = {
 5  dataset: [
 6    {
 7      source: rawData
 8    },
 9    {
10      transform: {
11        // 引用注册的数据转换器。
12        // 注意,每个外部的数据转换器,都有名空间(如 'ecStat:xxx','ecStat' 是名空间)。
13        // 而内置数据转换器(如 'filter', 'sort')没有名空间。
14        type: 'ecStat:regression',
15        config: {
16          // 这里是此外部数据转换器所需的参数。
17          method: 'exponential'
18        }
19      }
20    }
21  ],
22  xAxis: {},
23  yAxis: {},
24  series: [
25    {},
26    {}
27  ]
28};
-
聚集 (Aggregate) -
直方图 (Histogram) -
简单聚类 (Clustering) -
线性回归线 (Linear Regression) -
指数回归线 (Exponential Regression) -
对数回归线 (Logarithmic Regression) -
多项式回归线 (Polynomial Regression)
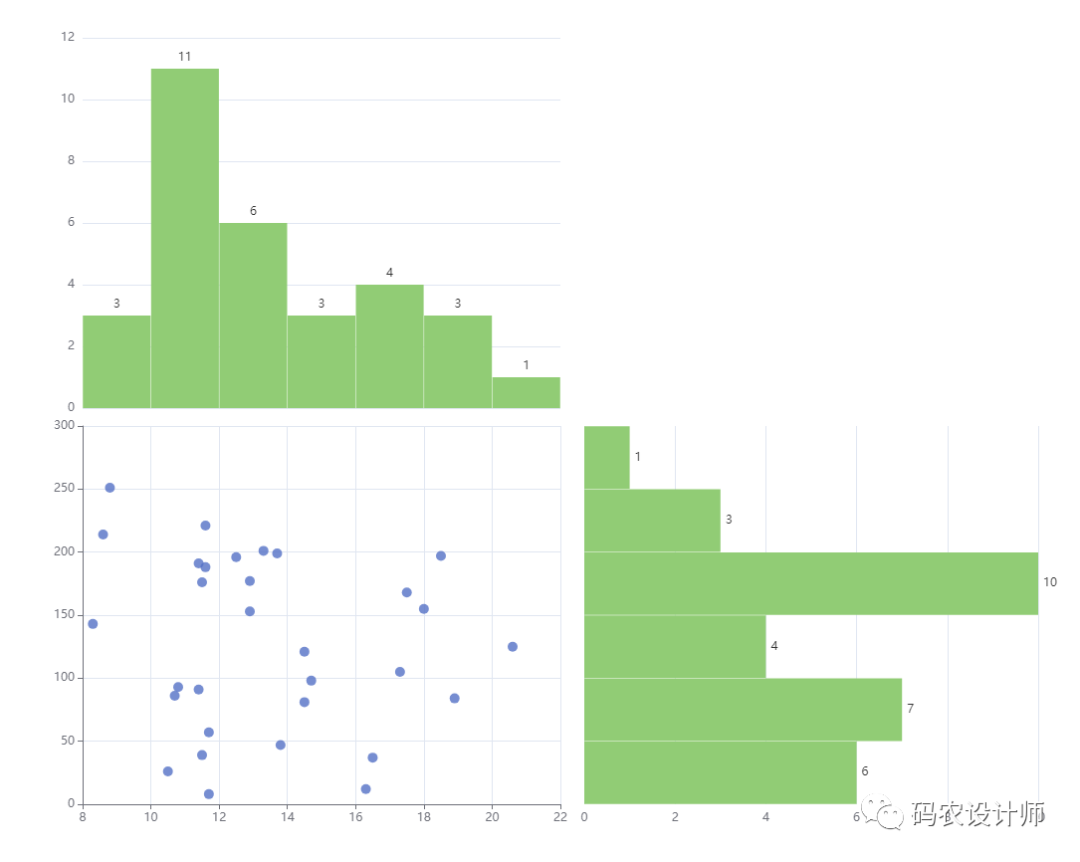
本次以生成数据的直方图为例:
代码如下所示:
  1<!DOCTYPE html>
  2<html>
  3
  4<head>
  5    <meta charset="utf-8">
  6    <!-- 引入下载的 echarts.js 文件 -->
  7    <script type="text/javascript" src="js/echarts.js"></script>
  8    <!-- 引入下载的 ecStat.js 文件 -->
  9    <script type="text/javascript" src="js/ecStat.js"></script>
 10    <title>ECharts图表</title>
 11</head>
 12
 13<body>
 14    <!-- 为 ECharts 准备一个定义了宽高的 DOM -->
 15    <div id="container" style="width:1200px;height:900px;"></div>
 16    <script type="text/javascript">
 17    // 基于准备好的dom,初始化echarts实例
 18    var myChart = echarts.init(document.getElementById('container'));
 19
 20    // 注册外部数据转换器
 21    echarts.registerTransform(ecStat.transform.histogram);
 22
 23    // 设置图表的参数
 24    var option = {
 25        title: {},
 26
 27        tooltip: {},
 28
 29        legend: { show: false },
 30
 31
 32        // 在数据集中设置数据
 33        dataset: [{
 34            // 设置数据
 35            source: [
 36                [8.3, 143],
 37                [8.6, 214],
 38                [8.8, 251],
 39                [10.5, 26],
 40                [10.7, 86],
 41                [10.8, 93],
 42                [11.5, 176],
 43                [11.5, 39],
 44                [11.6, 221],
 45                [11.6, 188],
 46                [11.7, 57],
 47                [11.4, 91],
 48                [11.4, 191],
 49                [11.7, 8],
 50                [12.5, 196],
 51                [12.9, 177],
 52                [12.9, 153],
 53                [13.3, 201],
 54                [13.7, 199],
 55                [13.8, 47],
 56                [14.5, 81],
 57                [14.7, 98],
 58                [14.5, 121],
 59                [16.5, 37],
 60                [16.3, 12],
 61                [17.3, 105],
 62                [17.5, 168],
 63                [18.9, 84],
 64                [18.5, 197],
 65                [18.0, 155],
 66                [20.6, 125]
 67            ]
 68        }, {
 69            // 引用注册的数据转换器。
 70            // 注意,每个外部的数据转换器,都有名空间(如 'ecStat:xxx','ecStat' 是名空间)。
 71            // 而内置数据转换器(如 'filter', 'sort')没有名空间。
 72            transform: {
 73                type: 'ecStat:histogram',
 74                print: true,
 75                // 这里是此外部数据转换器所需的参数
 76                config: { dimensions: [0] }
 77            }
 78        }, {
 79            transform: {
 80                type: 'ecStat:histogram',
 81                print: true,
 82                // 这里是此外部数据转换器所需的参数
 83                config: { dimensions: [1] }
 84            }
 85        }],
 86
 87        // 设置三个网格
 88        grid: [{
 89                top: '50%',
 90                right: '50%'
 91            },
 92            {
 93                bottom: '52%',
 94                right: '50%'
 95            },
 96            {
 97                top: '50%',
 98                left: '52%'
 99            }
100        ],
101
102        // x轴
103        xAxis: [{
104                scale: true,
105                gridIndex: 0
106            },
107            {
108                type: 'category',
109                scale: true,
110                axisTick: { show: false },
111                axisLabel: { show: false },
112                axisLine: { show: false },
113                gridIndex: 1
114            },
115            {
116                scale: true,
117                gridIndex: 2
118            }
119        ],
120
121        // y轴
122        yAxis: [{
123                gridIndex: 0
124            },
125            {
126                gridIndex: 1
127            },
128            {
129                type: 'category',
130                axisTick: { show: false },
131                axisLabel: { show: false },
132                axisLine: { show: false },
133                gridIndex: 2
134            }
135        ],
136
137        // 在数据系列中设置数据
138        series: [{
139                name: 'origianl scatter',
140                type: 'scatter',
141                xAxisIndex: 0,
142                yAxisIndex: 0,
143                encode: { tooltip: [0, 1] },
144                datasetIndex: 0
145            },
146            {
147                name: 'histogram',
148                type: 'bar',
149                xAxisIndex: 1,
150                yAxisIndex: 1,
151                barWidth: '99.3%',
152                label: {
153                    show: true,
154                    position: 'top'
155                },
156                encode: { x: 0, y: 1},
157                datasetIndex: 1
158            },
159            {
160                name: 'histogram',
161                type: 'bar',
162                xAxisIndex: 2,
163                yAxisIndex: 2,
164                barWidth: '99.3%',
165                label: {
166                    show: true,
167                    position: 'right'
168                },
169                encode: { x: 1, y: 0},
170                datasetIndex: 2
171            }
172        ]
173    };
174
175
176    // 使用指定的配置项和数据显示图表
177    myChart.setOption(option);
178    </script>
179</body>
180
181</html>
可视化结果如下图所示:

更多参数和配置可以查看官方文档:
1https://echarts.apache.org/zh/option.html


本篇文章来源于微信公众号: 码农设计师
