本系列文章配套代码获取有以下两种途径:
-
通过百度网盘获取:
链接:https://pan.baidu.com/s/1W26KrZK7RjwgxvulccTA9w?pwd=mnsj提取码:mnsj
-
前往GitHub获取:
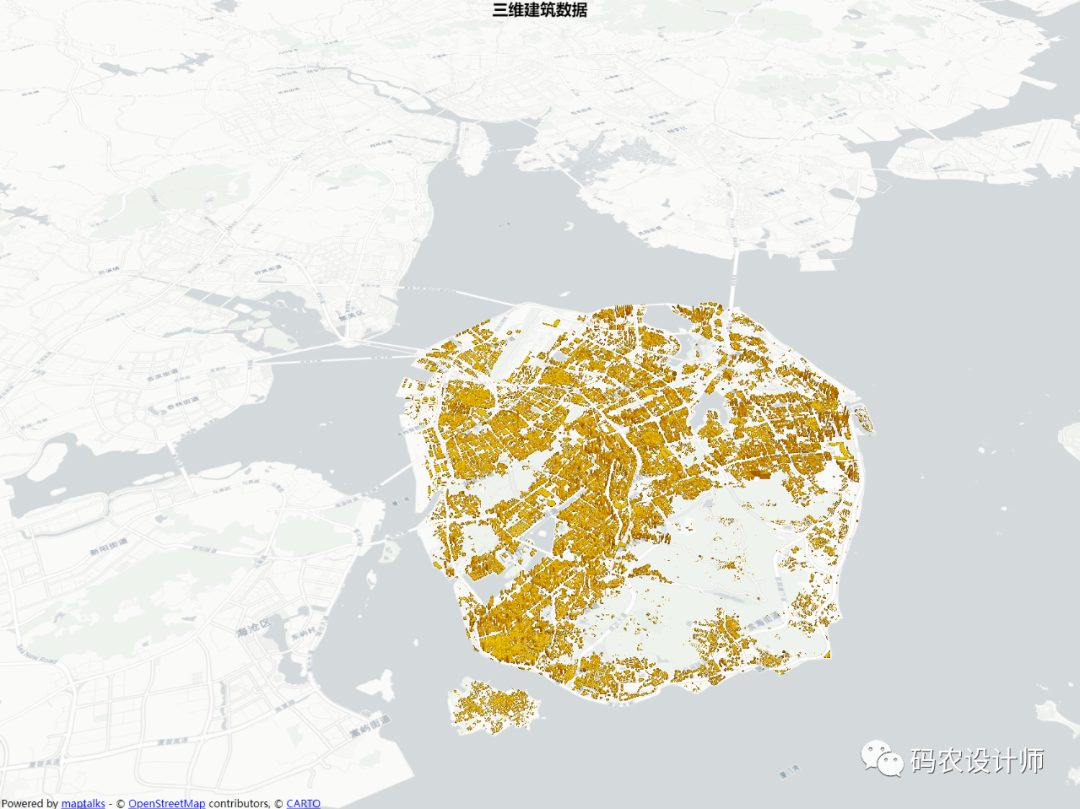
https://github.com/returu/Data_Visualization在ECharts中加载三维建筑数据需要将series中的type设置为"polygons3D"。
polygons3D用于可视化地图上带有高度信息的多边形数据,常用于建筑群的绘制。
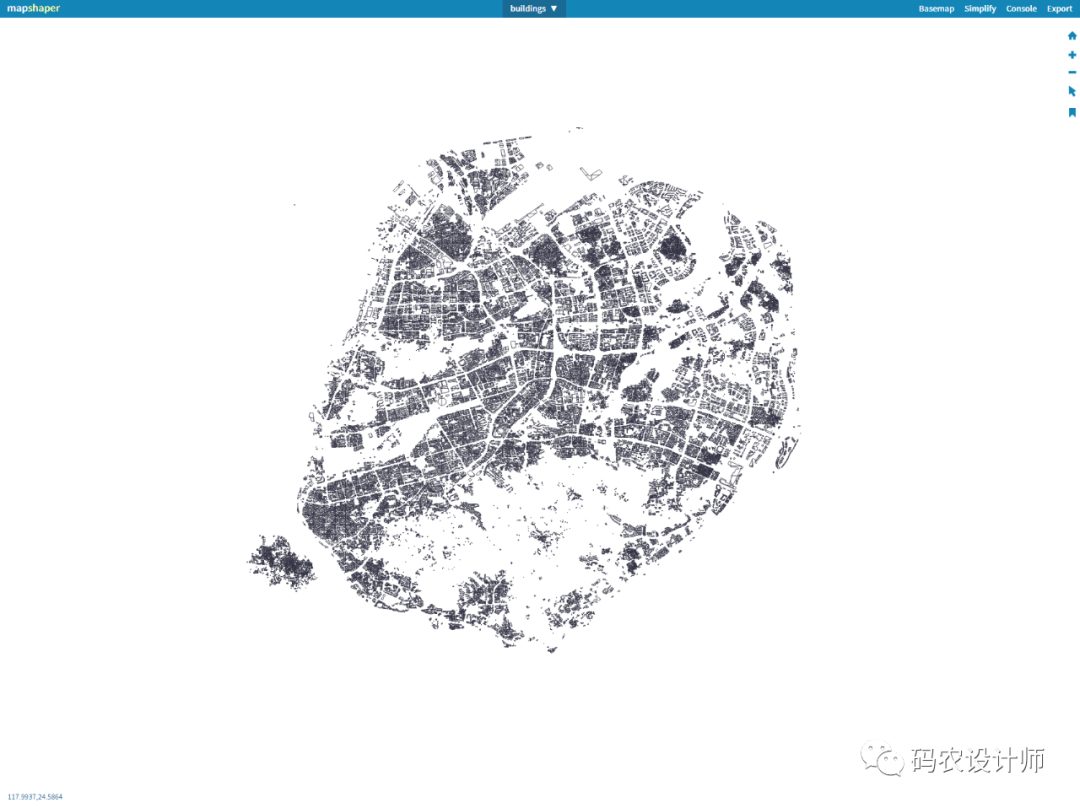
shp格式,可以通过QGIS这类软件查看,也可以通过mapshaper(网址如下)在线查看。https://mapshaper.org/

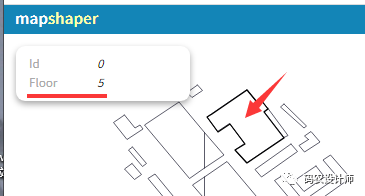
通过右侧工具栏的选择工具选择任意建筑面要素,可以看到其有Floor这一代表建筑层数的属性,后期可以以此估算建筑高度。

ECharts中加载数据格式要求为geojson格式,因此可以通过mapshaper进行格式转换。
data文件夹下。data: [{
// A square
coords: [[0, 0], [100, 0], [100, 100], [0, 100]],
// Height
height: 3
}, {
// A triangle
coords: [[50, 0], [100, 100], [0, 100]],
// Height
height: 5
}]
    $.getJSON('data/buildings.json', function(buildings) {
        console.log(buildings)
    })
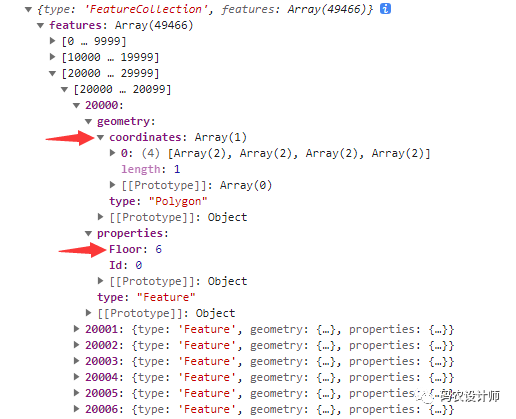
可以看到数据中的coordinates为建筑面数据各顶点的坐标信息,Floor为建筑层数信息:

    $.getJSON('data/buildings.json', function(buildings) {

        // console.log(buildings)

        var data = []
        for (var i = 0; i < buildings['features'].length; i++) {
            try {
                data.push({
                    coords: buildings['features'][i]['geometry']['coordinates'],
                    height: buildings['features'][i]['properties']['Floor'] * 7
                })
            } catch {}
        }
    })
            // 数据系列
            series: [{
                type: 'polygons3D',
                coordinateSystem: 'maptalks3D',
                data: data
            }],
    $.getJSON('data/buildings.json', function(buildings) {

        // console.log(buildings)

        var data = []
        for (var i = 0; i < buildings['features'].length; i++) {
            try {
                data.push({
                    coords: buildings['features'][i]['geometry']['coordinates'],
                    height: buildings['features'][i]['properties']['Floor'] * 7
                })
            } catch {}
        }


        // 设置图表的参数
        var option = {

            maptalks3D: {
                center: [118.12, 24.52], // 地图中心点坐标
                zoom: 13, // 缩放等级缩放等级
                pitch: 50, // 视角俯视的倾斜角度。默认为0,也就是垂直于地图表面。最大的值是60
                bearing: 30, // 地图的旋转角度
                // 绑定URL模板
                urlTemplate: 'http://{s}.basemaps.cartocdn.com/light_all/{z}/{x}/{y}.png',
                altitudeScale: 1, // 海拔的缩放,默认为1
                // 后处理特效的相关配置。
                // 后处理特效可以为画面添加高光、景深、环境光遮蔽(SSAO)、调色等效果,可以让整个画面更富有质感。
                postEffect: {
                    enable: true,
                    FXAA: {
                        enable: true
                    }
                },
                // 光照相关的设置
                light: {
                    // 场景主光源的设置
                    main: {
                        intensity: 1, // 主光源的强度
                        shadow: true, // 主光源是否投射阴影。默认为关闭
                        shadowQuality: 'high' // 阴影的质量。可选'low', 'medium', 'high', 'ultra'
                    },
                    // 全局的环境光设置
                    ambient: {
                        intensity: 0.2 // 环境光的强度
                    },
                }
            },

            title: {
                text: "三维建筑数据",
                left: "center",
                textStyle: { color: "#000", fontSize: 25 },
            },

            // 图例
            legend: {},

            // 数据系列
            series: [{
                type: 'polygons3D',
                coordinateSystem: 'maptalks3D',
                data: data,
                itemStyle:{
                    color:'orange'
                }
            }],
        };


        // 使用指定的配置项和数据显示图表
        myChart.setOption(option);
    })

更多参数和配置可以查看官方文档:
1https://echarts.apache.org/zh/option.html


本篇文章来源于微信公众号: 码农设计师
