本系列文章配套代码获取有以下两种途径:
-
通过百度网盘获取:
链接:https://pan.baidu.com/s/1W26KrZK7RjwgxvulccTA9w?pwd=mnsj提取码:mnsj
-
前往GitHub获取:
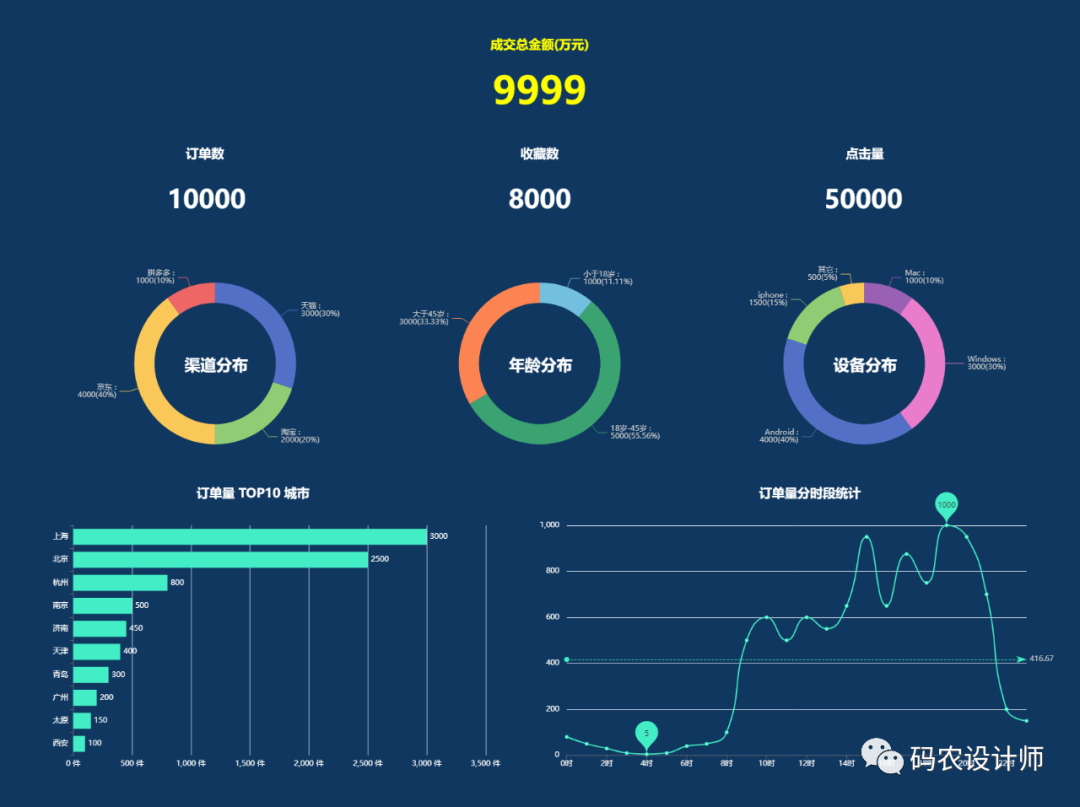
https://github.com/returu/Data_VisualizationDashboard,即商业智能仪表盘,主要用于呈现数据可视化效果。它可以帮助用户以图表、图形和表格的形式展示数据,并允许用户自定义和个性化仪表盘,以适应不同的数据可视化和可视设计需求。通过仪表盘,用户可以更快速地访问和理解数据,从而更好地进行决策和管理。ECharts中制作Dashboard仪表盘也很简单,只需将之前介绍的ECharts组件以及图表根据需要进行组合即可。本次将实现一个反映电商平台销售情况的Dashboard仪表盘,可视化效果如下所示(数据仅为示意):

可以通过以下步骤实现上述图表:
-
所有文字都在标题组件中,文字的位置通过
left和top来控制文字距离容器左侧和上侧的距离,并通过textStyle来设置文字的大小和颜色; -
通过
center设置饼图的中心(圆心)坐标,通过radius设置饼图的半径,通过字符串模板formatter设置饼图的文本标签; -
下方的条形图和折线图的位置通过
grid网格来设定,通过left、right、top、bottom来设定图表所占的空间大小,需要注意的是gridindex要与x、y轴相对应,series中的数据系列要与xAxisIndex、yAxisIndex相对应;
<!DOCTYPE html>
<html style="height:100%">

<head>
    <meta charset="utf-8">
    <!-- 引入下载的 echarts.js 文件 -->
    <script type="text/javascript" src="js/echarts.js"></script>
    <title>第一个ECharts图表</title>
</head>

<body style="height: 100%; margin: 0">
    <!-- 为 ECharts 准备一个定义了宽高的 DOM -->
    <div id="container" style="height:100%"></div>
    <script type="text/javascript">
    // 基于准备好的dom,初始化echarts实例
    var myChart = echarts.init(document.getElementById('container'));

    // 设置图表的参数
    var option = {
        // 背景色
        backgroundColor: '#0f375f',

        // 标题
        title: [{
                text: '成交总金额(万元)',
                left: 'center',
                top: '4.5%',
                textStyle: { fontSize: 20, color: '#ffff00' }
            },
            {
                text: '9999',
                left: 'center',
                top: '9%',
                textStyle: { fontSize: 60, color: '#ffff00' }
            },
            {
                text: '订单数',
                left: '17%',
                top: '18%',
                textStyle: { fontSize: 20, color: '#fff' }
            },
            {
                text: '10000',
                left: '15.3%',
                top: '23%',
                textStyle: { fontSize: 40, color: '#fff' }
            },
            {
                text: '收藏数',
                left: 'center',
                top: '18%',
                textStyle: { fontSize: 20, color: '#fff' }
            },
            {
                text: '8000',
                left: 'center',
                top: '23%',
                textStyle: { fontSize: 40, color: '#fff' }
            },
            {
                text: '点击量',
                left: '78%',
                top: '18%',
                textStyle: { fontSize: 20, color: '#fff' }
            },
            {
                text: '50000',
                left: '76%',
                top: '23%',
                textStyle: { fontSize: 40, color: '#fff' }
            },
            {
                text: '渠道分布',
                left: '19.8%',
                top: '45%',
                textAlign: 'center',
                textBaseline: 'middle',
                textStyle: { fontSize: 25, color: '#fff' }
            },
            {
                text: '年龄分布',
                left: '49.8%',
                top: '45%',
                textAlign: 'center',
                textBaseline: 'middle',
                textStyle: { fontSize: 25, color: '#fff' }
            },
            {
                text: '设备分布',
                left: '79.8%',
                top: '45%',
                textAlign: 'center',
                textBaseline: 'middle',
                textStyle: { fontSize: 25, color: '#fff' }
            },
            {
                text: '订单量 TOP10 城市',
                left: '18%',
                top: '60%',
                textStyle: { fontSize: 20, color: '#fff' }
            },
            {
                text: '订单量分时段统计',
                left: '70%',
                top: '60%',
                textStyle: { fontSize: 20, color: '#fff' }
            }
        ],

        // 提示框组件
        tooltip: {
            // 触发类型——坐标轴触发
            trigger: 'axis',
            // 坐标轴指示器配置项
            axisPointer: {
                // 指示器类型——阴影指示器
                type: 'shadow'
            }
        },

        // 网格部分
        grid: [{
                left: '5%',
                right: '55%',
                top: '65%',
                bottom: '5%',
                containLabel: true // grid 区域是否包含坐标轴的刻度标签
            },
            {
                left: '50%',
                right: '5%',
                top: '65%',
                bottom: '5%',
                containLabel: true
            }
        ],

        xAxis: [{
                gridindex: 0,
                type: 'value', // x轴
                // 坐标轴刻度标签的相关设置
                axisLabel: {
                    formatter: '{value} 件',
                    color: '#fff'
                },
            },
            {
                gridIndex: 1,
                type: 'category',
                boundaryGap: false,
                axisLabel: { color: '#fff' },
                data: ['0时', '1时', '2时', '3时', '4时', '5时',
                    '6时', '7时', '8时', '9时', '10时', '11时',
                    '12时', '13时', '14时', '15时', '16时', '17时',
                    '18时', '19时', '20时', '21时', '22时', '23时'
                ]
            }
        ],

        yAxis: [{
                type: 'category', // y轴
                data: ['上海', '北京', '杭州', '南京', '济南',
                    '天津', '青岛', '广州', '太原', '西安'
                ],
                inverse: true,// 是否是反向坐标轴
                // interval: 0,
                axisLabel: { color: '#fff' }
            },
            {
                gridIndex: 1,
                type: 'value',
                axisLabel: { formatter: '{value} ', color: '#fff' }
            }
        ],

        series: [{
                type: 'pie', // 饼图
                center: ['20%', '45%'],
                radius: ['15%', '20%'],
                label: { formatter: '{b} :n{c}({d}%)' }, // 通过字符串模板设置饼图的文本标签
                data: [{ value: 3000, name: '天猫' },
                    { value: 2000, name: '淘宝' },
                    { value: 4000, name: '京东' },
                    { value: 1000, name: '拼多多' }
                ]
            },
            {
                type: 'pie', // 饼图
                center: ['50%', '45%'],
                radius: ['15%', '20%'],
                label: { formatter: '{b} :n{c}({d}%)' },
                data: [{ value: 1000, name: '小于18岁' },
                    { value: 5000, name: '18岁-45岁' },
                    { value: 3000, name: '大于45岁' }
                ]
            },
            {
                type: 'pie', // 饼图
                center: ['80%', '45%'],
                radius: ['15%', '20%'],
                label: { formatter: '{b} :n{c}({d}%)' },
                data: [{ value: 1000, name: 'Mac' },
                    { value: 3000, name: 'Windows' },
                    { value: 4000, name: 'Android' },
                    { value: 1500, name: 'iphone' },
                    { value: 500, name: '其它' }
                ]
            },
            {
                xAxisIndex: 0,
                yAxisIndex: 0,
                type: 'bar', // 条形图
                label: {
                    show: true,
                    color: '#fff',
                    position: 'right'
                },
                data: [3000, 2500, 800, 500, 450, 400, 300, 200, 150, 100],
                itemStyle: { color: '#43eec6' }
            },
            {
                xAxisIndex: 1,
                yAxisIndex: 1,
                type: 'line', // 折线图
                data: ['80', '50', '30', '10', '5', '10',
                    '40', '50', '100', '500', '600', '500',
                    '600', '550', '650', '950', '650', '875',
                    '750', '1000', '950', '700', '200', '150'
                ],
                itemStyle: { color: '#43eec6' },
                smooth: true,
                markPoint: {
                    data: [{ type: 'max', name: '最大值', symbolSize: 60 },
                        { type: 'min', name: '最小值', symbolSize: 60 }
                    ],
                    itemStyle: { color: '#43eec6' }
                },
                markLine: {
                    data: [{ type: 'average', name: '平均值' }]
                }
            }
        ]
    };


    // 使用指定的配置项和数据显示图表
    myChart.setOption(option);
    </script>
</body>

</html>
1https://echarts.apache.org/zh/option.html


本篇文章来源于微信公众号: 码农设计师
