本系列文章配套代码获取有以下两种途径:
-
通过百度网盘获取:
链接:https://pan.baidu.com/s/1jG-rGG4QMuZu0t0kEEl7SA?pwd=mnsj提取码:mnsj
-
前往GitHub获取:
https://github.com/returu/Data_Visualizationplt.text (x, y, s, fontdict=None,**kwargs)
-
x、y:文字输出的左下角坐标,x, y不是绝对刻度,而是相对坐标刻度,大小会随着坐标刻度增减。 -
s:输出的字符串。 -
fontdict:使用字典设定文本属性。
其他常用的**kwargs参数如下:
-
alpha:透明度。
-
backgroundcolor:背景颜色。 -
bbox:用文本框显示文字。 -
color:文字颜色。 -
fontfamily:字体,如serif、sans-serif、cursive、fantasy、monospace。 -
fontsize:字体大小,浮点数,或是xx-small、x-small、small、medium、large、x-large、xX-large。 -
fontstretch 或 stretch:字体拉伸,取值为0 ~1000的数字,或是ultra-condensed、extra-condensed.condensed.semi-condensed、normal、semi-expanded、expanded、extra-expanded、ultra-expanded。 -
fontweight 或 weight:字体粗细,0 ~1000的数字,或是ultralight、light、normal、regular .book、medium、roman、semibold、demibold、demi、bold. heavy、extrabold.black。 -
horizontalalignment或 ha:水平居中,可以是center.left、right。rotation :旋转角度。 -
transform:图表轴的转换。 -
verticalalignment 或 va:垂直居中,可以是center.top、bottom、baseline、center_baseline。 -
wrap:可设定是否自动换行。 -
zorder:输出顺序,zorder值较小的先绘制。
-
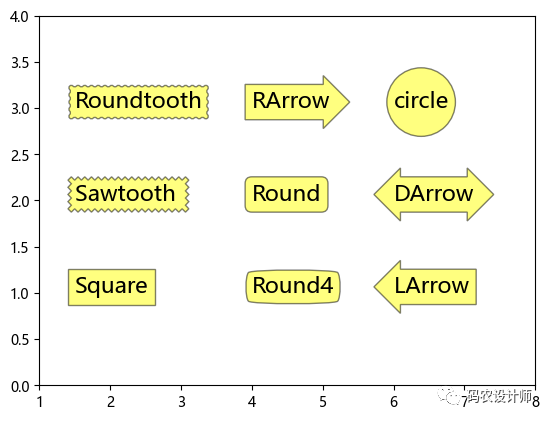
circle:圆形,默认pad=0.3; -
DArrow:双向箭头,默认pad=0.3; -
LArrow:左箭头,默认pad=0.3 -
RArrow:右箭头,默认pad=0.3; -
Round:圆角矩形,默认pad=0.3,rounding_size=None; -
Round4:圆角矩形,默认pad=0.3,rounding_size=None; -
Roundtooth:圆齿,默认pad=0.3,tooth_size=None; -
Sawtooth:锯齿,默认pad=0.3,tooth_size=None; -
Square:矩形,默认pad=0.3。
使用以下代码将各文本框样式进行可视化显示:
plt.axis([1,8,0,4])

# 文本框样式列表
bbox_list = ['circle' , 'DArrow' , 'LArrow' , 'RArrow' , 'Round' , 'Round4' , 'Roundtooth' , 'Sawtooth ' , 'Square']
# 位置列表
coord_list = [[6,3] , [6,2] , [6,1] , [4,3] , [4,2] , [4,1] , [1.5,3] , [1.5,2]  , [1.5,1]]

for i in range(len(bbox_list)):
    plt.text(coord_list[i][0],
             coord_list[i][1],
             s=bbox_list[i],
             fontsize=16,
             bbox=dict(boxstyle=bbox_list[i], fc='yellow', ec='k',lw=1 ,alpha=0.5)
            )

plt.show()

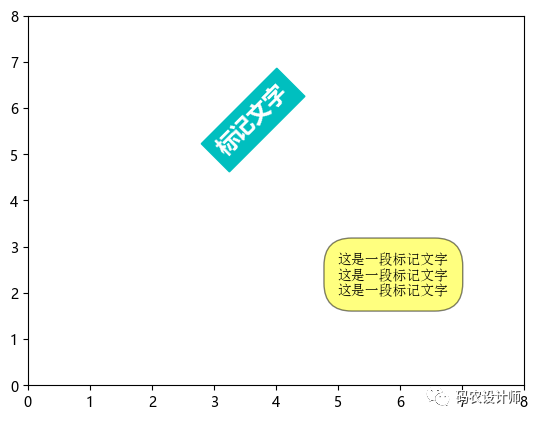
plt.axis([0,8,0,8])

# 标记文字
plt.text(x=3,
        y=5,
        s='标记文字',
        backgroundcolor='c', # 设定背景颜色
        color='w', # 文字颜色
        fontfamily='Microsoft YaHei', # 设定字体
        fontsize=16,
        fontweight='black',
        ha='left', # 水平居中
        va='baseline', # 垂直居中
        rotation=45, # 旋转角度
#         transform=plt.gca().transAxes
        )

# 标记文字
plt.text(5,
         2,
         s='这是一段标记文字n这是一段标记文字n这是一段标记文字',
         fontfamily='simsun', # 设定字体
         ha='left',
         wrap=True,# 自动换行
         bbox=dict(boxstyle='round,pad=1,rounding_size=2', fc='yellow', ec='k',lw=1 ,alpha=0.5) # 使用bbox参数建立文本框字符串
        )

plt.show()

更多内容可以前往官网查看:
https://matplotlib.org/stable/


本篇文章来源于微信公众号: 码农设计师
