本系列文章配套代码获取有以下两种途径:
-
通过百度网盘获取:
链接:https://pan.baidu.com/s/1jG-rGG4QMuZu0t0kEEl7SA?pwd=mnsj提取码:mnsj
-
前往GitHub获取:
https://github.com/returu/Data_Visualization函数语法:
add_gridspec(nrows,ncols,left,right,top,bottom,hspace,wspace)
-
nrows,ncols:网格的行数和列数,如果只有一个数字,则此数字代表行数。 -
left,right,top,bottom:gridspec网格占据图表的空间,单位是图表百分比。 -
wspace,hspace:gridspec各子图间的距离。
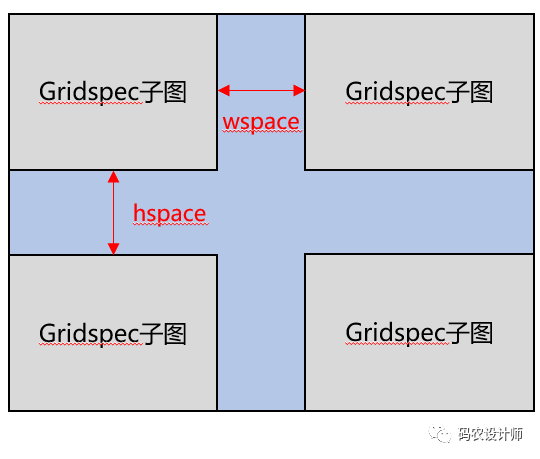
fig = plt.figure()
# 返回GridSpe
gs = fig.add_gridspec(2,2) # 创建2*2子图
子图配置实例:
-
实例1——等分的子图布局样式:
-
使用add_subplot()函数逐个添加 axes:
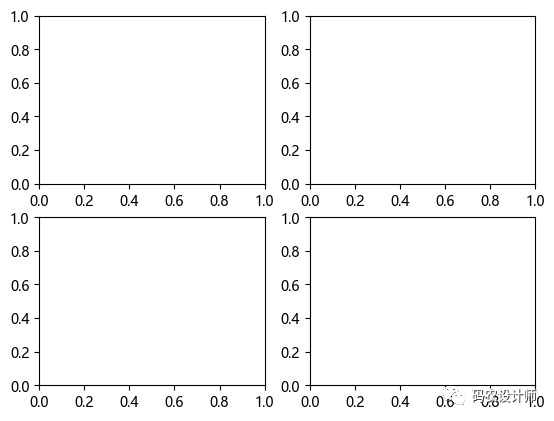
例如,创建2*2的子图布局:
fig = plt.figure()
# 返回GridSpe
gs = fig.add_gridspec(2,2) # 创建2*2子图

ax1 = fig.add_subplot(gs[0,0]) # 逐个添加 axes ,是 matplotlib 最初的工作方式
ax2 = fig.add_subplot(gs[0,1])
ax3 = fig.add_subplot(gs[1,0])
ax4 = fig.add_subplot(gs[1,1])

plt.show()
-
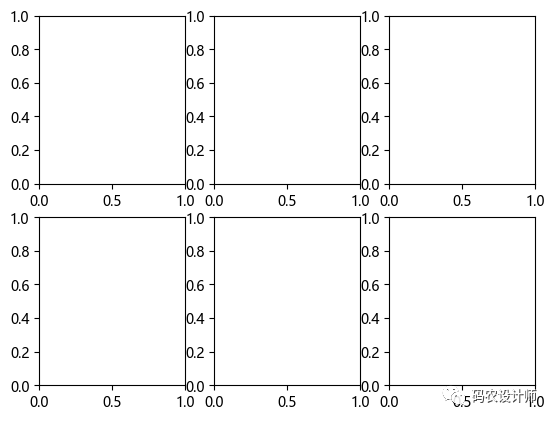
使用subplots()函数一次性添加多个子图:
fig = plt.figure()
# 返回GridSpe
gs = fig.add_gridspec(2,3) # 创建2*3子图

ax = gs.subplots() # 一次性添加多个子图,并且子图呈网格状排布

plt.show()
-
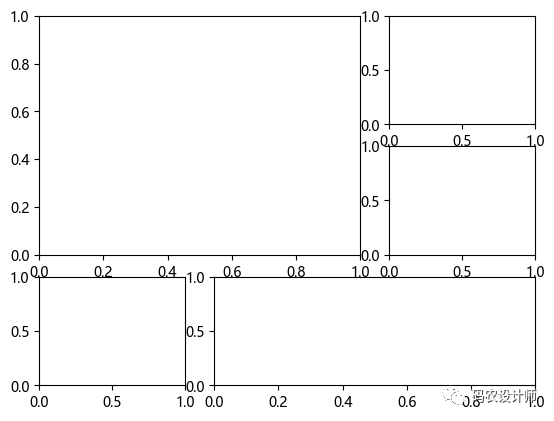
实例2——非等分的子图布局样式:
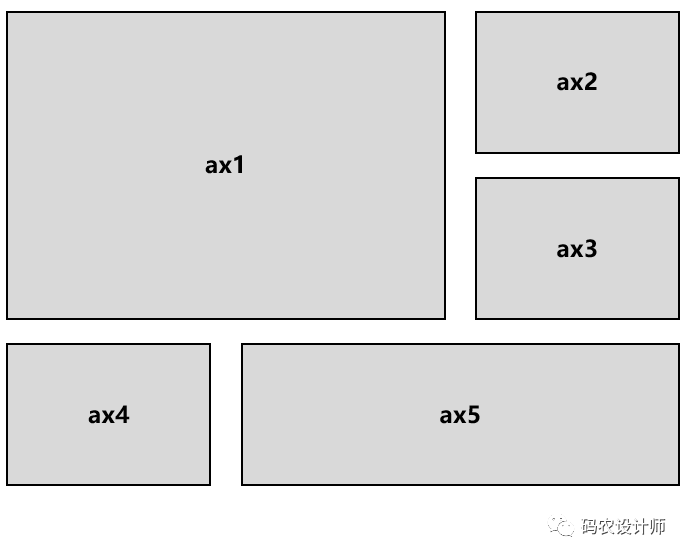
fig = plt.figure()
# 返回GridSpe
gs = fig.add_gridspec(3,3) # 创建3*3子图

ax1 = fig.add_subplot(gs[0:2,0:2]) # 切片模式
ax2 = fig.add_subplot(gs[0,2])
ax3 = fig.add_subplot(gs[1,2])
ax4 = fig.add_subplot(gs[2,0])
ax4 = fig.add_subplot(gs[2,1:]) # 切片模式

plt.show()
更多内容可以前往官网查看:
https://matplotlib.org/stable/


本篇文章来源于微信公众号: 码农设计师
