本系列文章配套代码获取有以下两种途径:
-
通过百度网盘获取:
链接:https://pan.baidu.com/s/1jG-rGG4QMuZu0t0kEEl7SA?pwd=mnsj提取码:mnsj
-
前往GitHub获取:
https://github.com/returu/Data_Visualization函数语法:
subplot_mosaic(mosaic, *,
               sharex=False,
               sharey=False,
               width_ratios=None,
               height_ratios=None,
               empty_sentinel='.',
               subplot_kw=None,
               gridspec_kw=None,
               per_subplot_kw=None,
               **fig_kw
               )
-
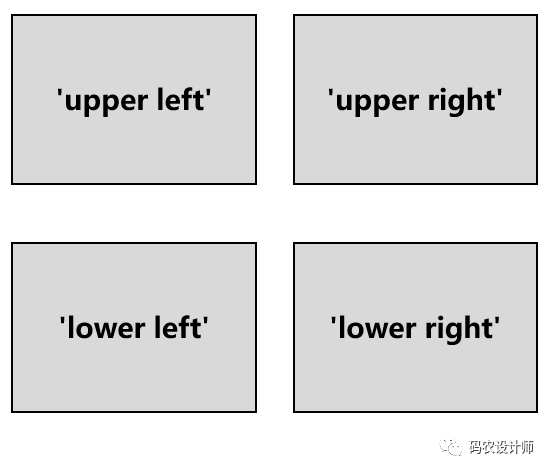
mosaic:将子图标记为字符串的可视化布局,可以是多行字符串、嵌套列表、ndarray,例如,[[‘upper left’, ‘upper right’],[‘lower left’, ‘lower right’]]形成了简单的四格布局(见下图),具体内容会通过后面的实例进行介绍; 
-
sharex、sharey:是否共享坐标轴; -
empty_sentinel:布局中表示 “将此空间留空”,默认为 “.”; -
gridspec_kw:传递给GridSpec构造函数的关键字的字典,该构造函数用于创建放置子图的网格; -
width_ratios、height_ratios:子图高度、宽度比例,传入内容是列表。如若报错,可以将其更改为通过gridspec_kw传参。
该函数返回一个figure和多个axes,其中,axes是一个带标签的字典,而不是数组。
子图配置实例:
-
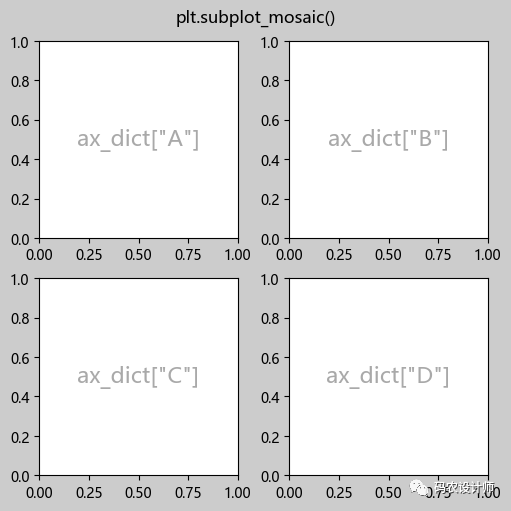
实例1——等分的子图布局样式:
# 创建四格布局,下面三种方式均可
# ①嵌套列表形式
mosaic = [['A', 'B'],
          ['C', 'D']]

# ②字符串形式
mosaic = "AB;CD"

# ③多行字符串形式
mosaic = """
         AB
         CD
         """

fig, ax_dict = plt.subplot_mosaic(mosaic,
                                  figsize=(5, 5),
                                  facecolor='0.8',
                                  constrained_layout=True)
for k in ax_dict:
    ax_dict[k].text(0.5, 0.5, f'ax_dict["{k}"]', ha='center', va='center', fontsize=16, color='darkgrey')

fig.suptitle('plt.subplot_mosaic()')
plt.show()
-
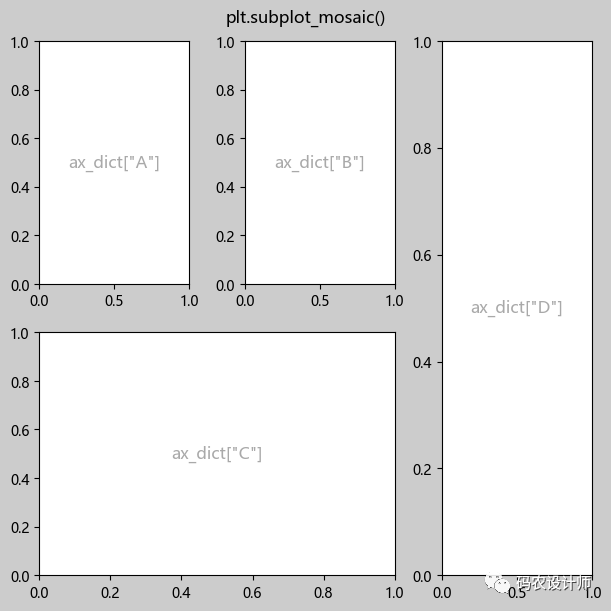
实例2——非等分的子图布局样式:
# 使用多行字符串
mosaic = """
         ABD
         CCD
         """

fig, ax_dict = plt.subplot_mosaic(mosaic,
                                  figsize=(6, 6),
                                  facecolor='0.8',
                                  constrained_layout=True)
for k in ax_dict:
    ax_dict[k].text(0.5, 0.5, f'ax_dict["{k}"]', ha='center', va='center', fontsize=12, color='darkgrey')

fig.suptitle('plt.subplot_mosaic()')
plt.show()
-
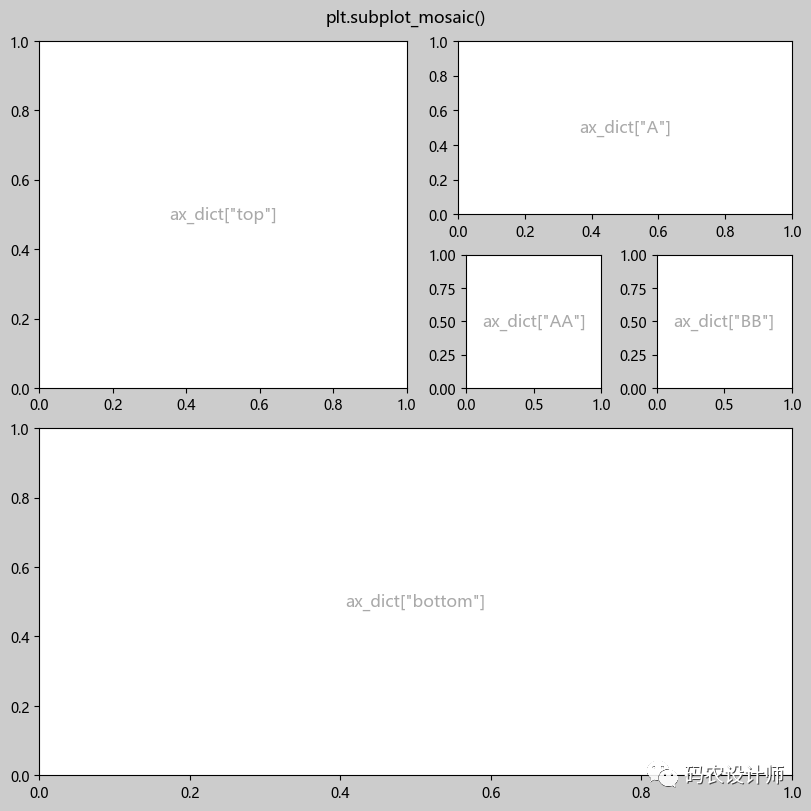
实例3——使用嵌套列表:
# 三个列表的嵌套
inner_inner = [
    ["AA","BB"],
]

inner = [
    ["A"],
    [inner_inner],
]

outer = [
    ["top", inner],
    ["bottom", "bottom"],
]

fig, ax_dict = plt.subplot_mosaic(outer,
                                  figsize=(8, 8),
                                  facecolor='0.8',
                                  constrained_layout=True)
for k in ax_dict:
    ax_dict[k].text(0.5, 0.5, f'ax_dict["{k}"]', ha='center', va='center', fontsize=12, color='darkgrey')

fig.suptitle('plt.subplot_mosaic()')
plt.show()
-
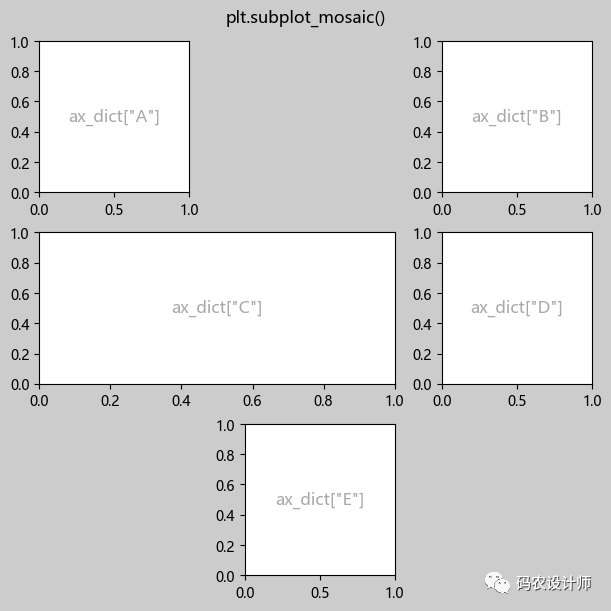
实例4——空白的表达方式:
# 默认“.”代表空白
mosaic ='''
        A.B
        CCD
        .E.
        '''

fig, ax_dict = plt.subplot_mosaic(mosaic,
                                  figsize=(6, 6),
                                  facecolor='0.8',
                                  constrained_layout=True
                                 )
for k in ax_dict:
    ax_dict[k].text(0.5, 0.5, f'ax_dict["{k}"]', ha='center', va='center', fontsize=12, color='darkgrey')

fig.suptitle('plt.subplot_mosaic()')
plt.show()
# 自定义代表空白的字符
mosaic = [
    ["A","BLANK", "B"],
    ["C","C", "D"],
    ["BLANK","E", "BLANK"]
]

fig, ax_dict = plt.subplot_mosaic(mosaic,
                                  figsize=(6, 6),
                                  facecolor='0.8',
                                  constrained_layout=True,
                                  empty_sentinel="BLANK",  # 自定义代表空白图片的字符
                                 )
for k in ax_dict:
    ax_dict[k].text(0.5, 0.5, f'ax_dict["{k}"]', ha='center', va='center', fontsize=12, color='darkgrey')

fig.suptitle('plt.subplot_mosaic()')
plt.show()
-
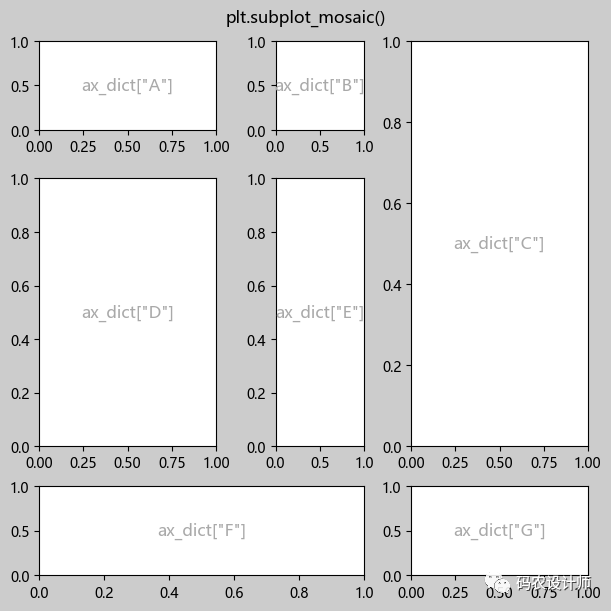
实例5——自定义宽高:
mosaic = """
    ABC
    DEC
    FFG
    """

# 通过 gridspec_kw 参数(字典),传递图表宽高比例(列表)
gs_kw = dict(width_ratios=[2, 1,2], height_ratios=[1, 3,1])

fig, ax_dict = plt.subplot_mosaic(mosaic,
                              figsize=(6, 6), facecolor='0.8', constrained_layout=True,gridspec_kw=gs_kw)
for k in ax_dict:
    ax_dict[k].text(0.5, 0.5, f'ax_dict["{k}"]', ha='center', va='center', fontsize=12, color='darkgrey')

fig.suptitle('plt.subplot_mosaic()')
plt.show()
gridspec_kw={
        "bottom": 0.5,
        "top": 0.8,
        "left": 0.2,
        "right": 0.9,
        "wspace": 0.3,
        "hspace": 0.3,
}更多内容可以前往官网查看:
https://matplotlib.org/stable/


本篇文章来源于微信公众号: 码农设计师

