本系列文章配套代码获取有以下两种途径:
-
通过百度网盘获取:
链接:https://pan.baidu.com/s/1jG-rGG4QMuZu0t0kEEl7SA?pwd=mnsj提取码:mnsj
-
前往GitHub获取:
https://github.com/returu/Data_Visualization当各子图均共享了xy轴时,为了图表显示效果,可能需要对子图坐标轴样式进行设置,本文将介绍一些常用函数。
首先,可以使用ax.set_xlabel()、ax.set_ylabel()分别设置x轴、y轴坐标标签,使用ax.set_title()函数设置标题。上述函数的参数与之前介绍的xlabel()、ylabel()、title()函数一致,具体内容可以查看之前文章,这里就不做过多介绍了。
tick_params()函数:
使用tick_params()函数对坐标轴刻度进行自定义设置,函数语法如下:
tick_params(axis='both', **kwargs)
常用参数如下所示:
-
axis: 可选”x”,”y”,”both”(默认),分别代表,对x轴操作、对y轴操作、对两个轴都操作。 -
direction: 可选”in”,”out”,”inout”,分别代表,刻度线显示在坐标轴里面,坐标轴外边,双边。 -
length: 刻度线长度; -
color: 刻度线颜色; -
width: 刻度线宽度; -
pad: 刻度线与刻度标签之间的间隔; -
bottom, top, left, right: 四个参数对应四个边框,True表示显示对应边框上的刻度线,False代表不显示,默认True。 -
labelbottom, labeltop, labelleft, labelright: 与上面四个对应,代表的是四个边框上的类标的设置,True代表显示对应边框上的类标,False代表不显示; -
labelsize: 类标大小,可取“medium”,”large”,”small”,也可取浮点型数值; -
labelrotation: 旋转类标角度。
x = np.linspace(0 , 10 , 100)

plt.figure(figsize=(8,8))

ax1 = plt.subplot(2,2,1)
ax1.set_title("子图1", color='b')
ax1.plot(x+5,np.power(x,1)*8)
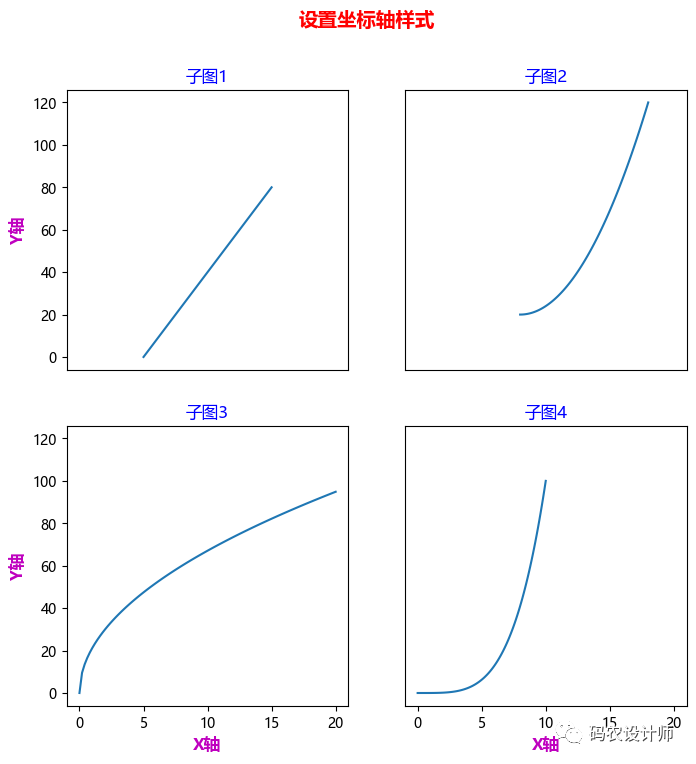
ax1.tick_params('x',labelbottom=False,bottom=False) # 取消刻度标签+刻度线
ax1.set_ylabel('Y轴', fontsize=12 , fontweight='bold', color='m') # 设置y轴坐标标签

ax2 = plt.subplot(2,2,2, sharex=ax1, sharey=ax1)
ax2.set_title("子图2", color='b')
ax2.plot(x+8,np.power(x,2)+20)
ax2.tick_params('both',labelbottom=False,labelleft=False,bottom=False,left=False) # 取消刻度标签+刻度线

ax3 = plt.subplot(2,2,3, sharex=ax1, sharey=ax1)
ax3.set_title("子图3", color='b')
ax3.plot(x*2,np.power(x,0.5)*30)
ax3.set_ylabel('Y轴', fontsize=12 , fontweight='bold', color='m') # 设置y轴坐标标签
ax3.set_xlabel('X轴', fontsize=12 , fontweight='bold', color='m') # 设置x轴坐标标签

ax4 = plt.subplot(2,2,4, sharex=ax1, sharey=ax1)
ax4.set_title("子图4", color='b')
ax4.plot(x,np.power(x,4)/100)
ax4.tick_params('y',labelleft=False,left=False) # 取消刻度标签+刻度线
ax4.set_xlabel('X轴', fontsize=12 , fontweight='bold', color='m') # 设置x轴坐标标签

plt.suptitle("设置坐标轴样式" , color='r' , fontsize=14 , fontweight='bold') # 设置主标题
plt.show()
可视化效果如下图所示:

spines()函数:
-
样式设置:
# 将左轴脊的线型设置为‘dotted’,线宽设置为2
ax.spines['left'].set_linestyle('dotted')
ax.spines['left'].set_linewidth(2)-
边框线颜色设置:
# 将左轴脊和下轴脊线颜色设置为蓝色
ax.spines['left'].set_color('blue')
ax.spines['bottom'].set_color('blue')

# 将所有轴脊的颜色设为绿色
ax.spines[:].set_color('green')
-
调整刻度线位置:
# 对左轴脊进行位置调整
ax.spines['left'].set_position(('outward', 10))
-
‘outward’:表示将轴脊置于移出数据区域指定点数的位置; -
‘axes’:表示将轴脊置于指定的坐标系中(0.0~1.0); -
‘data’:表示将轴脊置于指定的数据坐标的位置;
-
‘center’:值为(‘axes’,0.5); -
‘zero’:值为(‘data’,0.0)。
-
轴脊显示:
# 隐藏上轴脊和右轴脊
ax.spines[['top','right']].set_visible(False)
x = np.linspace(0 , 10 , 100)

fig,ax = plt.subplots(2,2,figsize=(8,8))

ax[0,0].set_title("子图1", color='b')
ax[0,0].plot(x+5,np.power(x,1)*8)
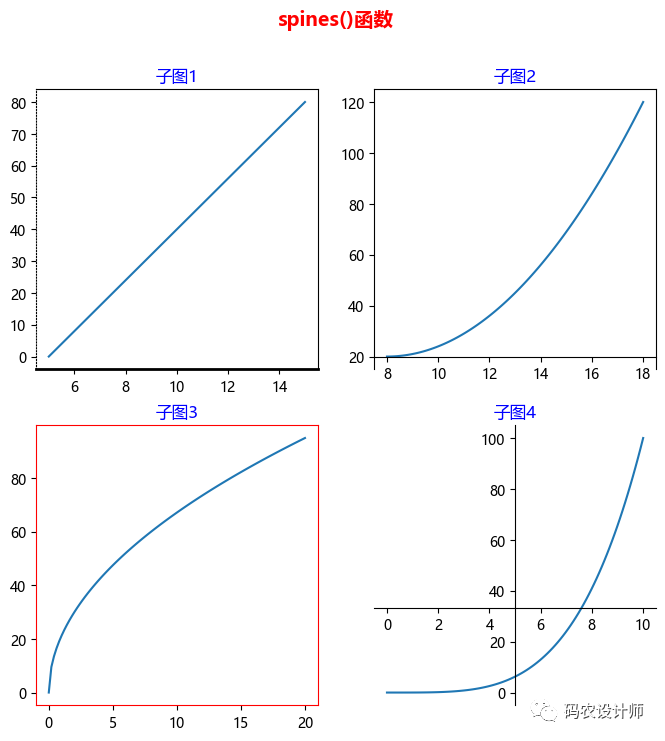
ax[0,0].spines['left'].set_linestyle('dotted') # 样式设置——线型设置
ax[0,0].spines['bottom'].set_linewidth(2) # 样式设置——线宽设置

ax[0,1].set_title("子图2", color='b')
ax[0,1].plot(x+8,np.power(x,2)+20)
ax[0,1].spines['bottom'].set_position(('data', 20)) # 将下边框线的位置设为y=20的位置

ax[1,0].set_title("子图3", color='b')
ax[1,0].plot(x*2,np.power(x,0.5)*30)
ax[1,0].spines[:].set_color('r') # 将所有边框线的颜色设为红色

ax[1,1].set_title("子图4", color='b')
ax[1,1].plot(x,np.power(x,4)/100)
ax[1,1].spines['left'].set_position(('center')) # 调整刻度线位置
ax[1,1].spines['bottom'].set_position(('outward',-70)) # 调整刻度线位置
ax[1,1].spines[['top','right']].set_visible(False) # 隐藏上轴脊和右轴脊


plt.suptitle("spines()函数" , color='r' , fontsize=14 , fontweight='bold') # 设置主标题
plt.show()

更多内容可以前往官网查看:
https://matplotlib.org/stable/


本篇文章来源于微信公众号: 码农设计师
