本系列文章配套代码获取有以下两种途径:
-
通过百度网盘获取:
链接:https://pan.baidu.com/s/1jG-rGG4QMuZu0t0kEEl7SA?pwd=mnsj提取码:mnsj
-
前往GitHub获取:
https://github.com/returu/Data_Visualization绘制图表时对折线图的线条类型和标记类型进行设置会极大地影数据可视化的效果。
| 字符 |
英文字符串 |
说明 |
| ‘-‘ |
‘solid’ | 实线样式(默认) |
| ‘–‘ | ‘dashed’ | 虚线样式 |
| ‘-.’ | ‘dashdot’ | 虚点线样式 |
| ‘:’ |
‘dotted’ | 虚点样式 |
TIPS:
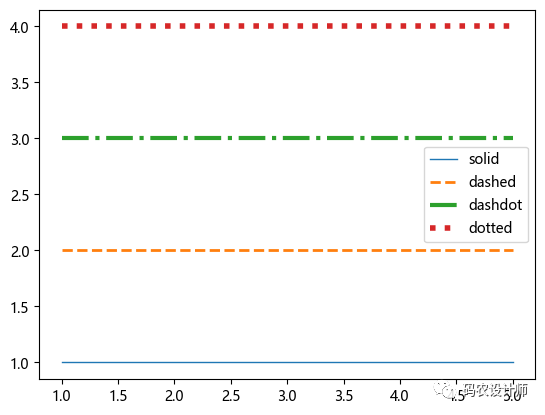
当使用ls或linestyle设定时,只能使用英文字符串设定样式。如果省略ls或linestyle时,则可以使用字符设定。
x = [1,5]

plt.plot(x,[1,1] , '-' , lw=1 , label='solid')
plt.plot(x,[2,2] , '--' , linewidth=2 , label='dashed')
plt.plot(x,[3,3] , ls='dashdot' , lw=3 , label='dashdot')
plt.plot(x,[4,4] , ls='dotted' , linewidth=4 , label='dotted')

plt.legend()
plt.show()

| 字符 |
说明 |
| ‘.’ |
点标记 |
| ‘,’ | 像素标记 |
| ‘o’ | 圆标记 |
| ‘v’ | 三角形向下标记 |
| ‘^’ | 三角形向上标记 |
| ‘<‘ | 左三角形 |
| ‘>’ | 右三角形 |
| ‘1’ |
tri_down标记 |
| ‘2’ | tri_up标记 |
| ‘3’ |
三左标记 |
| ‘4’ | 三右标记 |
| ‘s’ | 方形标记 |
| ‘p’ | 五角标记 |
| ‘*’ |
星星标记 |
| ‘+’ | 加号标记 |
| ‘D’ | 钻石记号笔 |
| ‘d’ | Thin_diamond标记 |
| ‘x’ | X标记 |
| ‘H’ |
八边形标记 |
| ‘h’ | 六边形标记 |
| ‘|’ |
竖线标记 |
| ‘_’ | 横线标记 |
另外,可以使用如下参数自定义标记的大小与颜色:
-
markersize,简写为 ms:定义标记的大小;
-
markerfacecolor,简写为 mfc:定义标记内部的颜色;
-
markeredgecolor,简写为 mec:定义标记边框的颜色;
-
markeredgewidth,简写为 mew:定义标记边框的宽度。
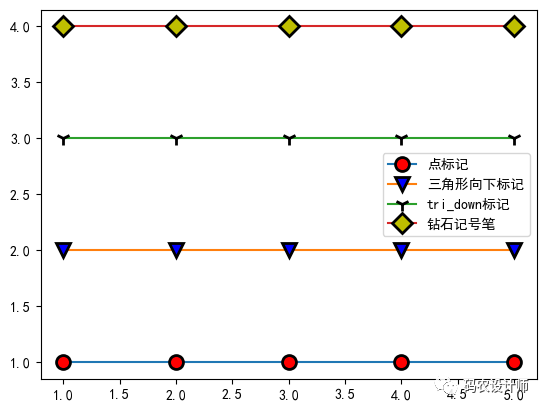
实例代码如下所示:
x = [1,2,3,4,5]

plt.plot(x,[1,1,1,1,1] , marker='.' ,markersize=20,markerfacecolor='r',markeredgecolor='k',markeredgewidth=2, label='点标记')
plt.plot(x,[2,2,2,2,2] , marker='v' ,ms=10,mfc='b',mec='k',mew=2, label='三角形向下标记')
plt.plot(x,[3,3,3,3,3] , marker='1' ,ms=10,mec='k',mew=2, label='tri_down标记')
plt.plot(x,[4,4,4,4,4] , marker='D' ,ms=10,mfc='y',mec='k',mew=2,  label='钻石记号笔')

plt.legend()
plt.show()
可视化效果如下图所示:

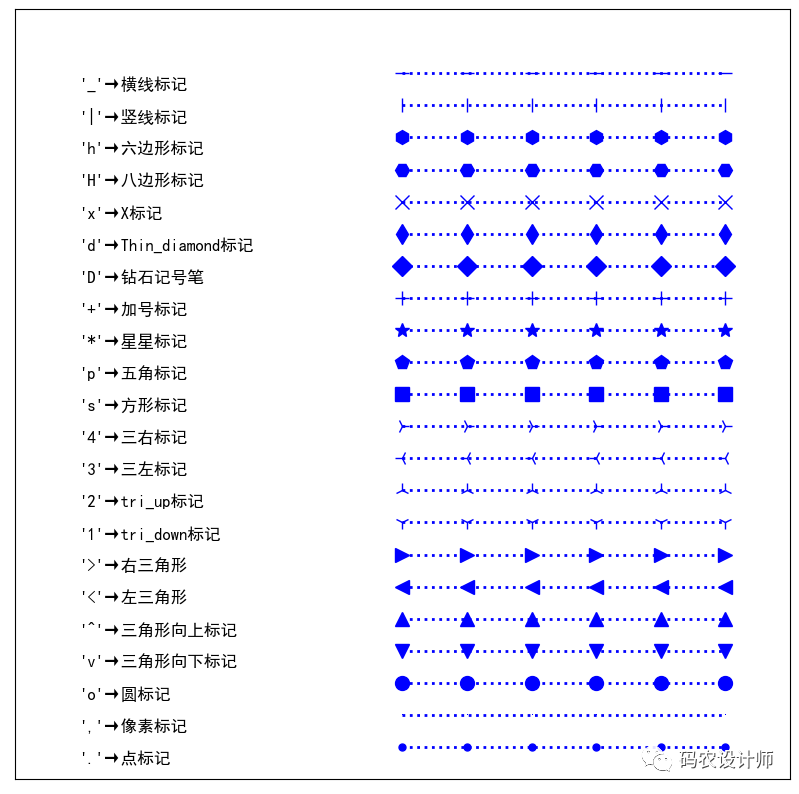
font_style = dict(family='SimHei',color='k',size=12)
line_marker_style = dict(linestyle=':',linewidth=2,color='b',markersize=10)

fig = plt.figure(figsize=(10,10))
ax = fig.add_subplot(1, 1, 1)

msNameList = ["'.'→点标记",
              "','→像素标记",
              "'o'→圆标记",
              "'v'→三角形向下标记",
              "'^'→三角形向上标记",
              "'<'→左三角形",
              "'>'→右三角形",
              "'1'→tri_down标记",
              "'2'→tri_up标记",
              "'3'→三左标记",
              "'4'→三右标记",
              "'s'→方形标记",
              "'p'→五角标记",
              "'*'→星星标记",
              "'+'→加号标记",
              "'D'→钻石记号笔",
              "'d'→Thin_diamond标记",
              "'x'→X标记",
              "'H'→八边形标记",
              "'h'→六边形标记",
              "'|'→竖线标记",
              "'_'→横线标记"
             ]

markerstyleList = ['.',',','o','v','^','<','>','1','2','3','4','s','p','*','+','D','d','x','H','h','|','_']

x = [ 5,  6,  7,  8,  9, 10]
y = [1, 1, 1, 1, 1, 1]


for i,ms in enumerate(markerstyleList):
    ax.text(0,i+0.5,msNameList[i] , **font_style)
    ax.plot(x,list(map(lambda x:x+i,y)),marker=ms , **line_marker_style)


ax.set_xlim(-1,11)
ax.set_ylim(0,24)
ax.set_xticks([])
ax.set_yticks([])

plt.show()
可视化效果如下图所示:

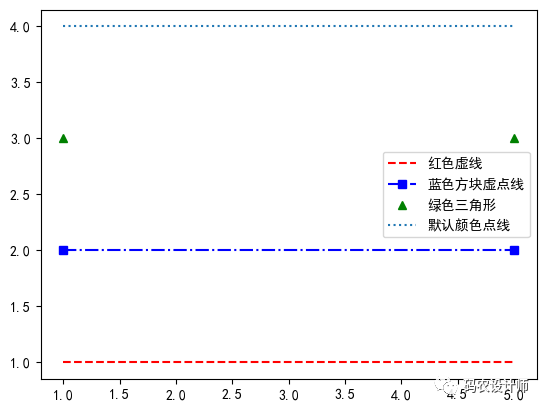
x = [1,5]

plt.plot(x,[1,1] , 'r--' , label='红色虚线')
plt.plot(x,[2,2] , 'bs-.' , label='蓝色方块虚点线')
plt.plot(x,[3,3] , 'g^' , label='绿色三角形')
plt.plot(x,[4,4] , ls=':' , label='默认颜色点线')

plt.legend()
plt.show()

更多内容可以前往官网查看:
https://matplotlib.org/stable/


本篇文章来源于微信公众号: 码农设计师
