本系列文章是根据GeoPandas官方文档翻译整理,学习任何一个Python第三方库,其官方文档都是最好的学习资料。相比网络搜索得到的一些资料,官方文档是权威的一手资料,其内容全面、准确可靠。通过官方文档入手,能够保证学习认知不会有大偏差。在学习完官方文档后,可以在寻找其他资料进一步学习。
点击“阅读原文”或者直接访问下方链接,查看翻译整理的“GeoPandas 0.12.2 中文文档”。
https://www.mizhushare.com/docs-
可以通过百度网盘获取,需要在本地配置代码运行环境:
链接:https://pan.baidu.com/s/185Qs6RpVhyP2nm9VV39Ehw?pwd=mnsj提取码:mnsj
-
前往GitHub详情页面,单击 code 按钮,选择Download ZIP选项:
https://github.com/returu/geopandasGeoPandas提供了Shapely库中所有用于几何操作的工具。本次以全国区县行政区划数据为例,为例方便演示,仅选取其中的部分数据:
 1china = gpd.read_file("./datasets/china/china_counties.shp")
 2points = gpd.read_file("./datasets/china/china_counties_points.shp")
 3
 4region = china[:200:30]
 5region = region.reset_index()
 6
 7points = points[:200:20]
 8points = points.reset_index()
 9
10# 转换到投影坐标系
11region = region.to_crs("EPSG:3857")
12points = points.to_crs("EPSG:3857")
13
14# 绘图
15f,ax = plt.subplots(figsize=(8,8))
16
17region.plot(ax=ax,edgecolor="k",facecolor='green',alpha=0.3)
18points.plot(ax=ax,markersize=10,color="red")
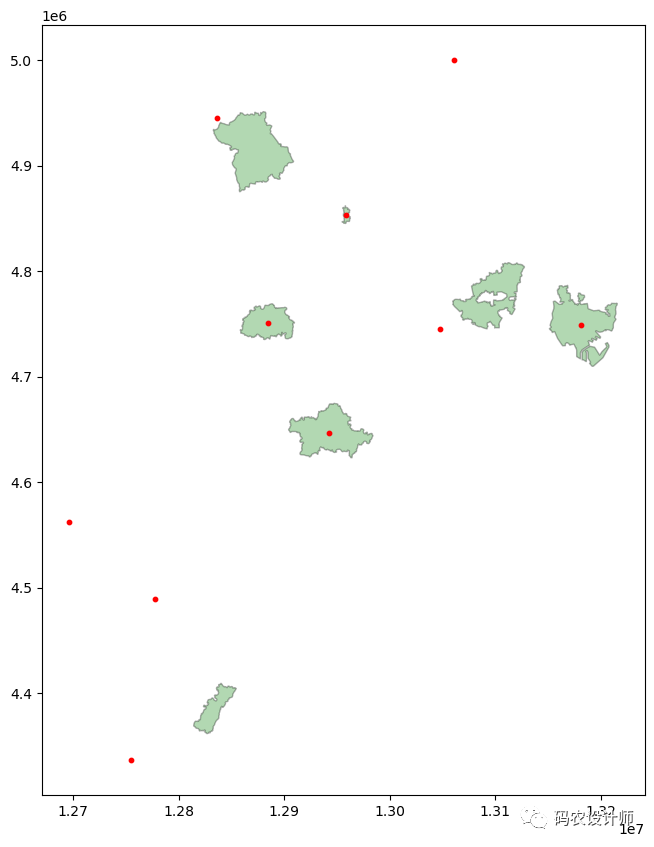
绘图结果如下所示:
构造型方法:
-
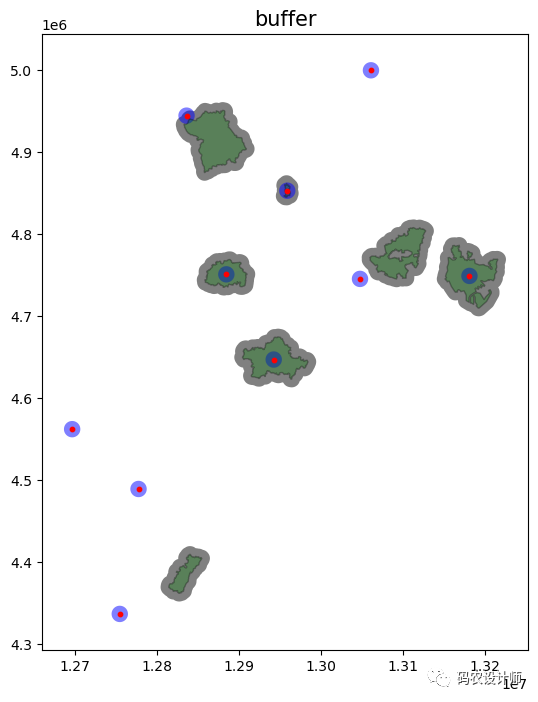
GeoSeries.buffer(distance, resolution=16):
返回一个表示每个几何图形对象在给定距离内的所有点的GeoSeries。
1f,ax = plt.subplots(figsize=(8,8))
2
3# buffer操作
4region.buffer(10000).plot(ax=ax,facecolor='gray')
5points.buffer(10000).plot(ax=ax,facecolor='blue',alpha=0.5)
6
7region.plot(ax=ax,edgecolor="k",facecolor='green',alpha=0.3)
8points.plot(ax=ax,markersize=10,color="red")
9ax.set_title('buffer',color="k",size=15)
结果如下图所示:
-
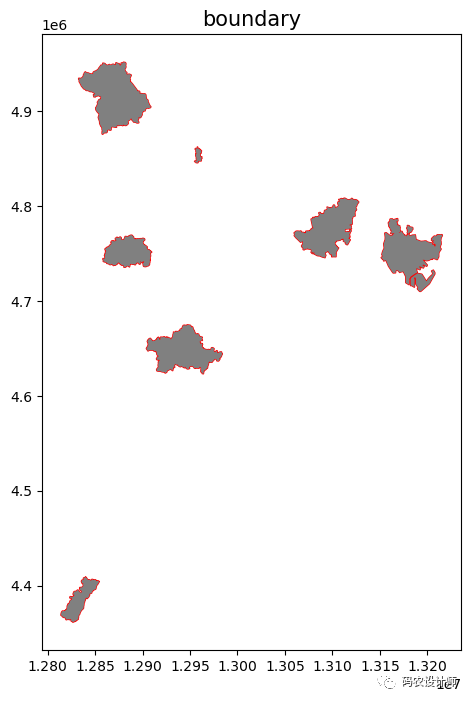
GeoSeries.boundary:
返回一个表示每个几何体的集合理论边界的低维的GeoSeries对象。
1f,ax = plt.subplots(figsize=(8,8))
2
3# boundary操作
4region.boundary.plot(ax=ax,facecolor='gray',edgecolor="none")
5
6region.plot(ax=ax,edgecolor="red")
7ax.set_title('boundary',color="k",size=15)
结果如下图所示:
-
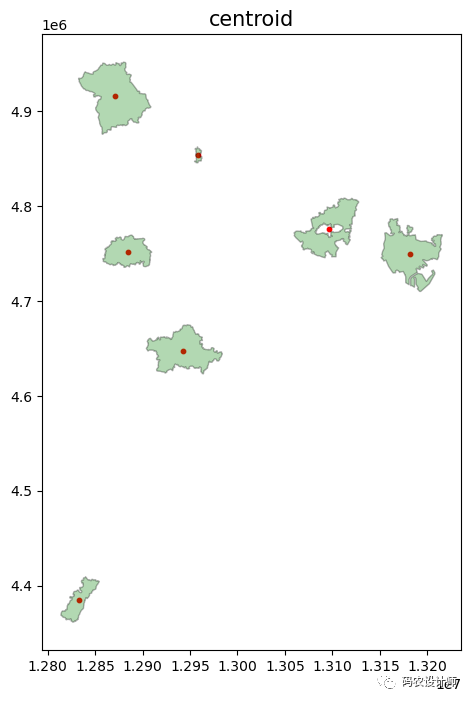
GeoSeries.centroid:
返回表示每个几何图形质心组成的 GeoSeries。
1f,ax = plt.subplots(figsize=(8,8))
2
3# centroid操作
4region.centroid.plot(ax=ax,markersize=10,color="red")
5
6region.plot(ax=ax,edgecolor="k",facecolor='green',alpha=0.3)
7ax.set_title('centroid',color="k",size=15)
结果如下图所示:
-
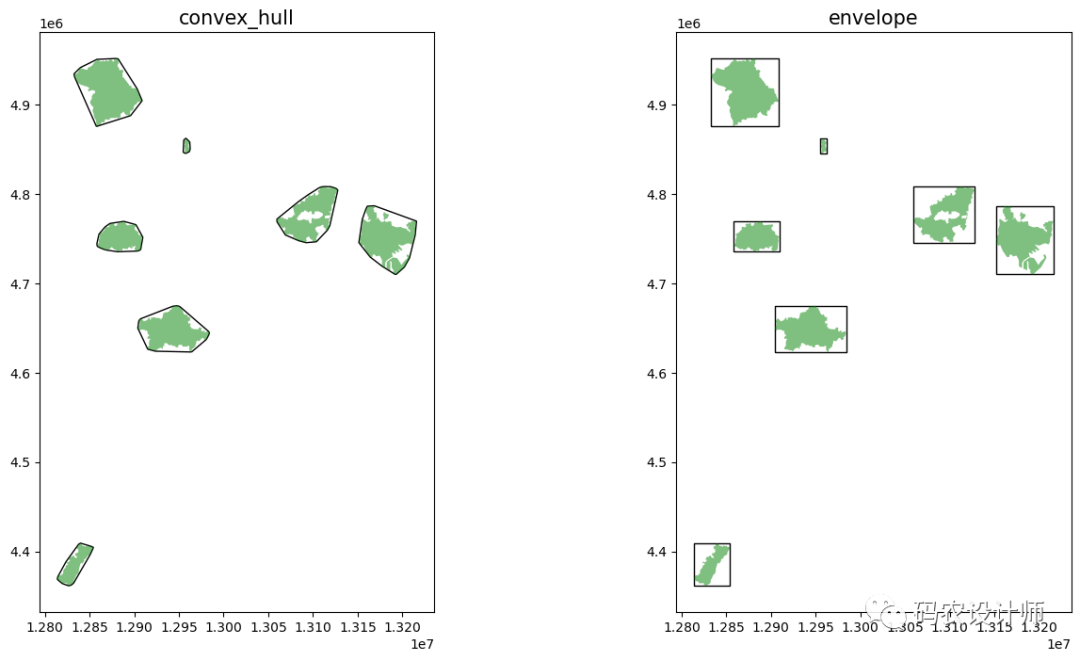
GeoSeries.convex_hull:
当点的数量少于3个时,返回一个表示包含每个几何对象中所有点的最小的凸形多边形组成的GeoSeries。对于两个点,凸面体塌陷为LineString;对于1个点,则为一个点。
-
GeoSeries.envelope:
返回一个表示包含每个对象的最小矩形多边形(边平行于坐标轴)的 GeoSeries。
 1f,ax = plt.subplots(1,2,figsize=(16,8))
 2
 3# convex_hull操作
 4region.convex_hull.plot(ax=ax[0],edgecolor="k",facecolor='none')
 5region.plot(ax=ax[0],edgecolor="none",facecolor='green',alpha=0.5)
 6ax[0].set_title('convex_hull',color="k",size=15)
 7
 8# envelope操作
 9region.envelope.plot(ax=ax[1],edgecolor="k",facecolor='none')
10region.plot(ax=ax[1],edgecolor="none",facecolor='green',alpha=0.5)
11ax[1].set_title('envelope',color="k",size=15)
结果如下图所示:
-
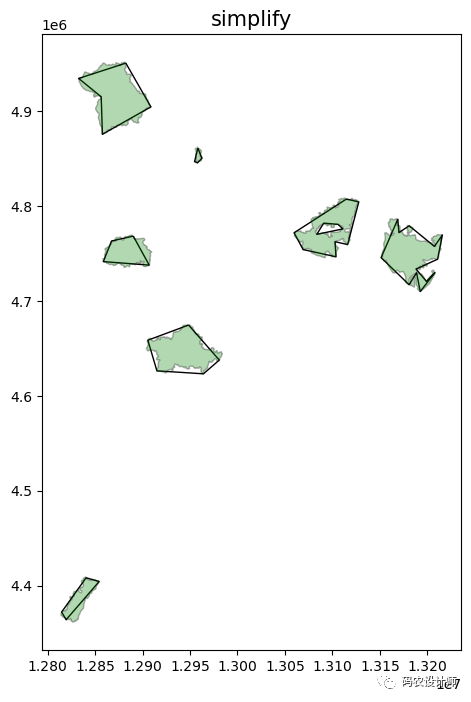
GeoSeries.simplify(tolerance, preserve_topology=True):
返回表示每个对象的简化表示的 GeoSeries。
1f,ax = plt.subplots(figsize=(8,8))
2
3# simplify操作
4region.simplify(tolerance=10000).plot(ax=ax,edgecolor="k",facecolor='none')
5
6region.plot(ax=ax,edgecolor="k",facecolor='green',alpha=0.3)
7ax.set_title('simplify',color="k",size=15)
结果如下图所示:
-
GeoSeries.unary_union:
返回包含 GeoSeries 中所有几何图形的并集的几何图形。
 1>>> result = region.unary_union
 2
 3# MultiPolygon
 4>>> type(result)
 5shapely.geometry.multipolygon.MultiPolygon
 6
 7>>> list(result.geoms)
 8[<POLYGON ((12840666.552 4408347.088, 12840745.49 4408346.964, 12840799.036 4...>,
 9 <POLYGON ((12949171.057 4674426.942, 12949214.432 4674434.532, 12949881.354 ...>,
10 <POLYGON ((13168919.47 4784678.276, 13168925.937 4784611.749, 13168922.493 4...>,
11 <POLYGON ((12890661.157 4766012.696, 12891440.688 4765363.398, 12891962.731 ...>,
12 <POLYGON ((13115414.35 4806674.622, 13115546.732 4806577.934, 13115622.878 4...>,
13 <POLYGON ((12959684.363 4860246.527, 12960194.528 4859856.532, 12960163.332 ...>,
14 <POLYGON ((12882576.37 4949113.701, 12882522.209 4948975.367, 12882489.694 4...>]
15
16>>> region.area
170    7.135373e+07
181    1.950620e+09
192    2.392439e+09
203    7.079196e+08
214    1.192909e+09
225    3.052810e+09
236    2.165703e+09
24dtype: float64
25
26# 返回所有面的面积总和
27>>> result.area
2811533754712.560368
仿射变换:
-
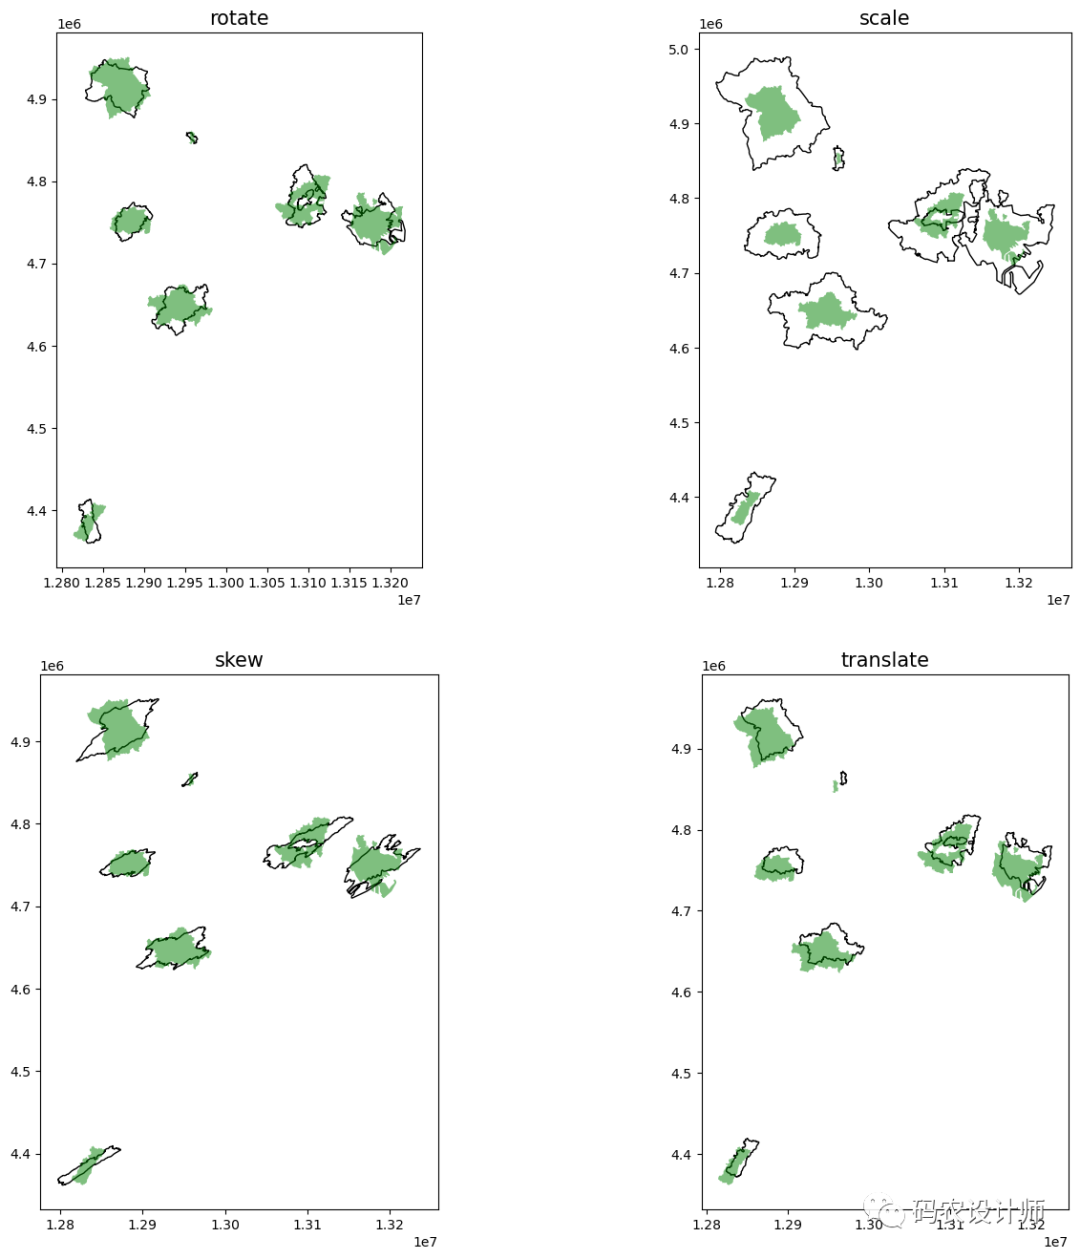
GeoSeries.rotate(self, angle, origin=’center’, use_radians=False):
旋转 GeoSeries 的坐标。
-
GeoSeries.scale(self, xfact=1.0, yfact=1.0, zfact=1.0, origin=’center’):
沿每个 (x, y, z) 维度缩放 GeoSeries 的几何图形。
-
GeoSeries.skew(self, angle, origin=’center’, use_radians=False):
沿 x 和 y 维度按角度剪切/倾斜 GeoSeries 的几何图形。
-
GeoSeries.translate(self, xoff=0.0, yoff=0.0, zoff=0.0):
移动 GeoSeries 的坐标。
 1f,ax = plt.subplots(2,2,figsize=(16,16))
 2
 3region.rotate(angle=45).plot(ax=ax[0,0],edgecolor="k",facecolor='none')
 4region.plot(ax=ax[0,0],edgecolor="none",facecolor='green',alpha=0.5)
 5ax[0,0].set_title('rotate',color="k",size=15)
 6
 7region.scale(xfact=2,yfact=2).plot(ax=ax[0,1],edgecolor="k",facecolor='none')
 8region.plot(ax=ax[0,1],edgecolor="none",facecolor='green',alpha=0.5)
 9ax[0,1].set_title('scale',color="k",size=15)
10
11region.skew(45).plot(ax=ax[1,0],edgecolor="k",facecolor='none')
12region.plot(ax=ax[1,0],edgecolor="none",facecolor='green',alpha=0.5)
13ax[1,0].set_title('skew',color="k",size=15)
14
15region.translate(xoff=10000,yoff=10000).plot(ax=ax[1,1],edgecolor="k",facecolor='none')
16region.plot(ax=ax[1,1],edgecolor="none",facecolor='green',alpha=0.5)
17ax[1,1].set_title('translate',color="k",size=15)
结果如下图所示:
-
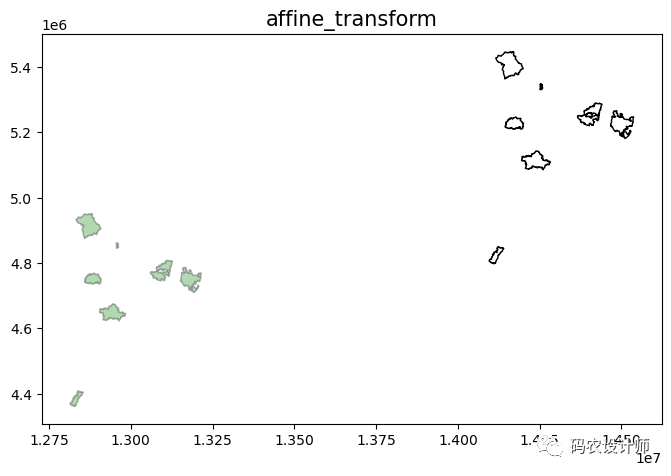
GeoSeries.affine_transform(self, matrix):
使用仿射变换矩阵变换 GeoSeries 的几何形状。
1f,ax = plt.subplots(figsize=(8,8))
2
3region.affine_transform([1.1,0,0,1.1,0,0]).plot(ax=ax,edgecolor="k",facecolor='none')
4region.plot(ax=ax,edgecolor="k",facecolor='green',alpha=0.3)
5ax.set_title('affine_transform',color="k",size=15)
结果如下图所示:


本篇文章来源于微信公众号: 码农设计师
