本系列文章是根据GeoPandas官方文档翻译整理,学习任何一个Python第三方库,其官方文档都是最好的学习资料。相比网络搜索得到的一些资料,官方文档是权威的一手资料,其内容全面、准确可靠。通过官方文档入手,能够保证学习认知不会有大偏差。在学习完官方文档后,可以在寻找其他资料进一步学习。
点击“阅读原文”或者直接访问下方链接,查看翻译整理的“GeoPandas 0.12.2 中文文档”。
https://www.mizhushare.com/docs-
可以通过百度网盘获取,需要在本地配置代码运行环境:
链接:https://pan.baidu.com/s/185Qs6RpVhyP2nm9VV39Ehw?pwd=mnsj提取码:mnsj
-
前往GitHub详情页面,单击 code 按钮,选择Download ZIP选项:
https://github.com/returu/geopandasGeoPandas库中通过 overlay() 方法实现。下图展示了基本的集合操作,但需要注意的是,overlay() 是在DataFrame层面上操作的,而不是在单个几何体上,而且两者的属性都会被保留。实际上,对于左边GeoDataFrame中的每个形状,这个操作是针对右边GeoDataFrame中的每个其他形状执行的。

创建示例数据:
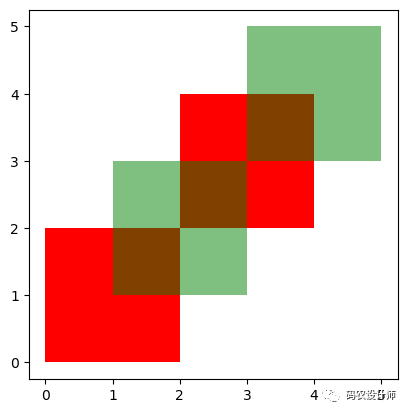
首先生成两个有一些重叠的区域GeoDataFrame对象(红色和绿色分别代表两个几何对象df1和df2):
 1import geopandas as gpd
 2from shapely.geometry import Polygon
 3
 4polys1 = gpd.GeoSeries([Polygon([(0,0), (2,0), (2,2), (0,2)]),Polygon([(2,2), (4,2), (4,4), (2,4)])])
 5polys2 = gpd.GeoSeries([Polygon([(1,1), (3,1), (3,3), (1,3)]),Polygon([(3,3), (5,3), (5,5), (3,5)])])
 6
 7
 8df1 = gpd.GeoDataFrame({'geometry': polys1, 'df1':[1,2]})
 9df2 = gpd.GeoDataFrame({'geometry': polys2, 'df2':[1,2]})
10
11# 绘图
12ax = df1.plot(color='red')
13df2.plot(ax=ax, color='green', alpha=0.5)
overlay()操作:
overlay()方法通过how参数决定两个输入的GeoDataFrames的叠加模式:
1GeoDataFrame.overlay(right,
2                     how='intersection',
3                     keep_geom_type=None,
4                     make_valid=True)
keep_geom_type keyword参数:在默认设置中,overlay() 仅返回与 GeoDataFrame(左侧)具有相同几何类型的几何图形,其中 Polygon 和 MultiPolygon 被视为相同类型(其他类型同样)。你可以使用 keep_geom_type 选项控制此行为,该选项默认设置为 True。一旦设置为 False,overlay 将返回由选定的设置操作产生的所有几何类型。例如,两个多边形相交于一条线或一个点的接触几何图形的交集可能会产生不同的类型。
-
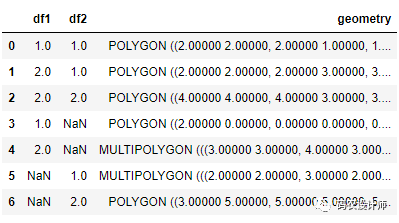
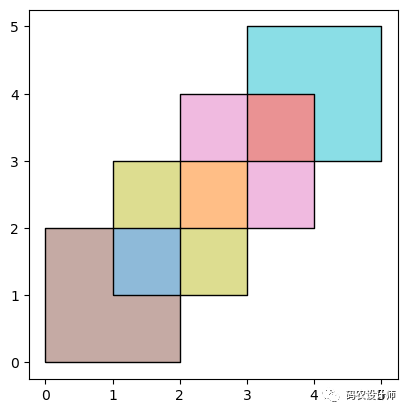
how=’union’:
会返回所有这些可能的几何图形。
1res_union = df1.overlay(df2 , how="union")
2res_union
1ax = res_union.plot(alpha=0.5, cmap='tab10')
2
3df1.plot(ax=ax, facecolor='none', edgecolor='k')
4df2.plot(ax=ax, facecolor='none', edgecolor='k')
-
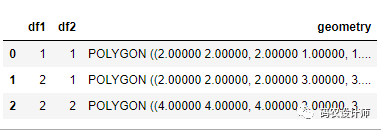
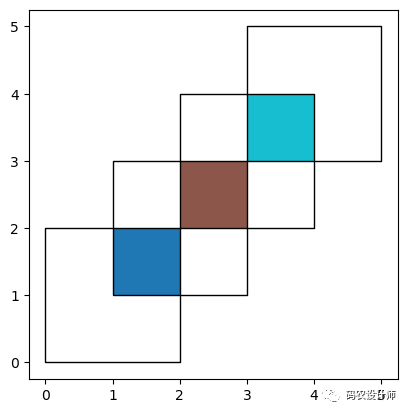
how=’intersection’:
只返回两个GeoDataFrame均包含的几何图形。
1res_intersection = df1.overlay(df2, how='intersection')
2res_intersection
1ax = res_intersection.plot(cmap='tab10')
2
3df1.plot(ax=ax, facecolor='none', edgecolor='k')
4df2.plot(ax=ax, facecolor='none', edgecolor='k')
-
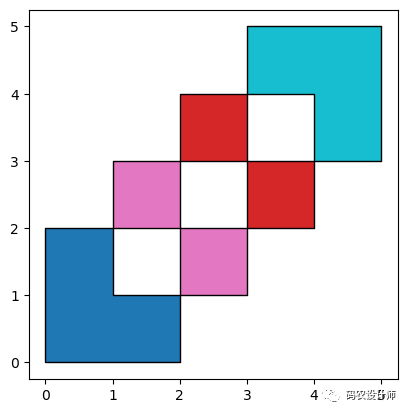
how=’symmetric_difference’:
与’intersection’相反,返回只属于其中一个GeoDataFrames但不属于两者的几何图形。
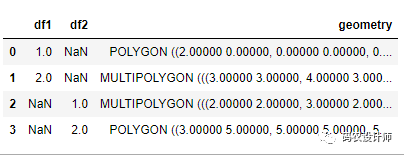
1res_symdiff = df1.overlay(df2, how='symmetric_difference')
2res_symdiff
1ax = res_symdiff.plot(cmap='tab10')
2
3df1.plot(ax=ax, facecolor='none', edgecolor='k')
4df2.plot(ax=ax, facecolor='none', edgecolor='k')
-
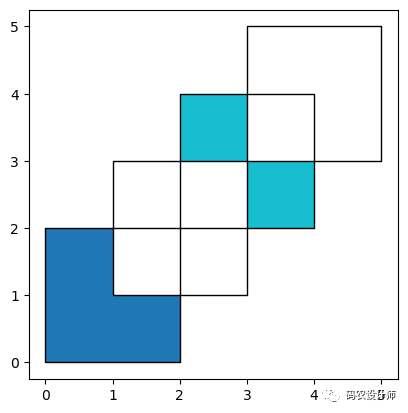
how=’difference’:
返回只属于 df1 但不包含在 df2(right参数传入) 中的几何图形。
1res_difference = df1.overlay(df2, how='difference')
2res_difference

1ax = res_difference.plot(cmap='tab10')
2
3df1.plot(ax=ax, facecolor='none', edgecolor='k')
4df2.plot(ax=ax, facecolor='none', edgecolor='k')
-
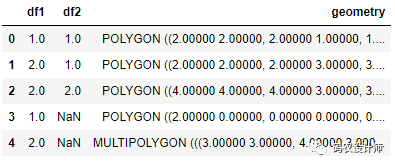
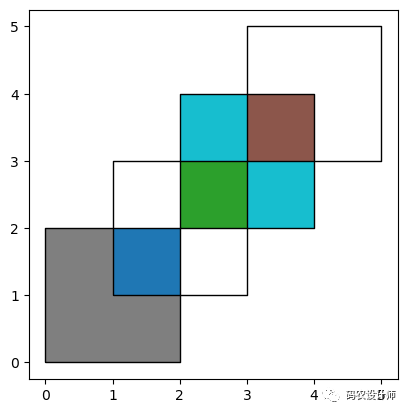
how=’identity’:
计算输入要素df1和标识要素df2的几何交集,与标识要素重叠的输入要素或输入要素的一部分将获得这些标识要素的属性。
1res_identity = df1.overlay(df2, how='identity')
2res_identity
1ax = res_identity.plot(cmap='tab10')
2
3df1.plot(ax=ax, facecolor='none', edgecolor='k')
4df2.plot(ax=ax, facecolor='none', edgecolor='k')
示例:
使用GeoPandas自带的world数据集为例。
首先,加载国家和城市示例数据集并进行筛选:
 1world = gpd.read_file('./datasets/naturalearth_lowres/naturalearth_lowres.shp')
 2capitals = gpd.read_file('./datasets/naturalearth_cities/naturalearth_cities.shp')
 3
 4# 选择南美洲
 5countries = world[world['continent'] == "South America"]
 6
 7# 只选择两列数据
 8countries = countries[['geometry', 'name']]
 9
10# 转换为投影坐标系
11countries = countries.to_crs('epsg:3395')
12capitals = capitals.to_crs('epsg:3395')
13
14# 绘图
15ax = countries.plot(figsize=(10,8))
16capitals.plot(ax=ax ,color="k" , markersize=12)
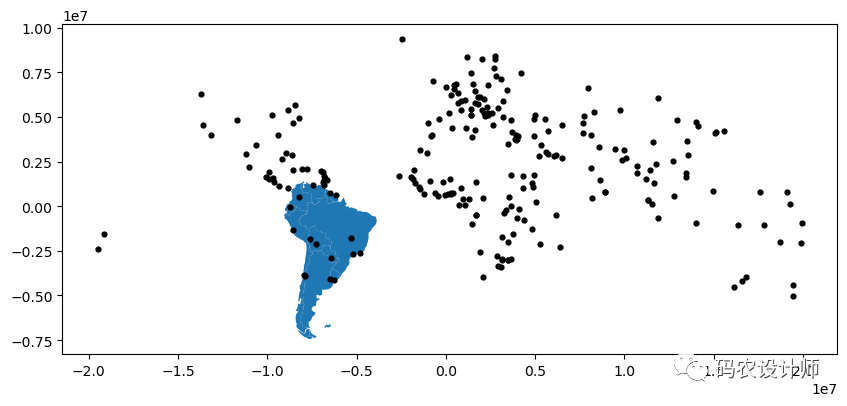
假设我们希望使用国家 GeoDataFrame 和首都 GeoDataFrame 来识别每个国家的“核心”部分——首都 500 公里以内的区域。
首先需要生成相应距离的缓冲区:
1# 生成 500km 缓冲区
2capitals['geometry']= capitals.buffer(500000)
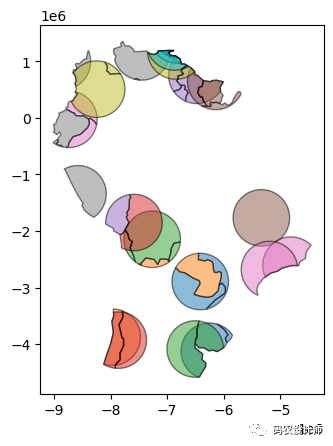
为了只选择首都500公里范围内的国家部分,我们指定how='intersection',这将在这两层重叠的地方创建一个新的多边形集合。
1country_cores = countries.overlay(capitals, how='intersection')
2
3country_cores.plot(alpha=0.5, edgecolor='k', cmap='tab10')
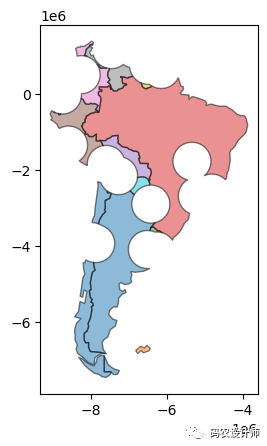
改变 “how “参数可以进行不同类型的叠加操作。例如,如果我们对远离首都的国家部分(边缘地区)感兴趣,我们将计算两者的差值。
1country_peripheries = countries.overlay(capitals, how='difference')
2
3country_peripheries.plot(alpha=0.5, edgecolor='k', cmap='tab10')


本篇文章来源于微信公众号: 码农设计师
