本系列文章是根据GeoPandas官方文档翻译整理,学习任何一个Python第三方库,其官方文档都是最好的学习资料。相比网络搜索得到的一些资料,官方文档是权威的一手资料,其内容全面、准确可靠。通过官方文档入手,能够保证学习认知不会有大偏差。在学习完官方文档后,可以在寻找其他资料进一步学习。
点击“阅读原文”或者直接访问下方链接,查看翻译整理的“GeoPandas 0.12.2 中文文档”。
https://www.mizhushare.com/docs-
可以通过百度网盘获取,需要在本地配置代码运行环境:
链接:https://pan.baidu.com/s/185Qs6RpVhyP2nm9VV39Ehw?pwd=mnsj提取码:mnsj
-
前往GitHub详情页面,单击 code 按钮,选择Download ZIP选项:
https://github.com/returu/geopandasGeoDataFrame是一个包含GeoSeries的表格式数据结构。GeoDataFrame最重要的属性是它总是有一个拥有特殊地位的GeoSeries列。这个GeoSeries列被称为GeoDataFrame的 "geometry"列。
当一个空间方法被应用于GeoDataFrame时(例如像area这样的空间属性被调用时),该方法将始终作用于 "geometry"列。
“geometry”列,无论其名称如何,都可以通过几何属性 (gdf.geometry) 访问,并且可以通过gdf.geometry.name 得到geometry列的名称。
GeoDataFrame还可以包含其他具有shapely几何对象的列,但一次只能有一个列是活动几何。要更改哪一列是活动几何列,需要使用 GeoDataFrame.set_geometry() 方法。
通过生成的随机点构造GeoDataFrame对象:
 1>>> x = np.random.randn(10)
 2>>> y = np.random.randn(10)
 3>>> points = [Point(i) for i in list(zip(x,y))]
 4
 5>>> gdf = gpd.GeoDataFrame({'num':range(1,len(points)+1) , 'col':points})
 6>>> gdf
 7   num                                              col
 80    1   POINT (-1.5066786725661974 0.0084970873716768)
 91    2   POINT (-1.524835473671481 -0.8187389312285182)
102    3  POINT (-0.5333473363037464 -0.4146964855277326)
113    4   POINT (0.3746934869600756 -0.7085231264476282)
124    5   POINT (-0.5115406829865624 1.4007052833483047)
135    6  POINT (-0.0323300120686044 -0.8222442397896093)
146    7   POINT (0.5159722323285981 -0.9079404858336346)
157    8   POINT (-0.7661493473481021 0.1003612924782094)
168    9    POINT (-0.02885048194364 -0.8870545125174846)
179   10   POINT (-0.0322190148441992 0.2637237816495491)
此时,访问“geometry”列会报错,这是因为还未指定哪一列是活动几何列:
1# 访问"geometry"列--会报错
2>>> gdf.geometry
3AttributeError: You are calling a geospatial method on the GeoDataFrame, but the active geometry column ('geometry') is not present.
4There are no existing columns with geometry data type. You can add a geometry column as the active geometry column with df.set_geometry.
使用 GeoDataFrame.set_geometry() 方法,将"col"列设置为活动几何列,
 1# 设置那一列是"geometry"列
 2>>> gdf = gdf.set_geometry('col')
 3>>> gdf
 4   num                        col
 50    1   POINT (-1.50668 0.00850)
 61    2  POINT (-1.52484 -0.81874)
 72    3  POINT (-0.53335 -0.41470)
 83    4   POINT (0.37469 -0.70852)
 94    5   POINT (-0.51154 1.40071)
105    6  POINT (-0.03233 -0.82224)
116    7   POINT (0.51597 -0.90794)
127    8   POINT (-0.76615 0.10036)
138    9  POINT (-0.02885 -0.88705)
149   10   POINT (-0.03222 0.26372)
15
16# 获取geometry列
17>>> gdf.geometry
180     POINT (-1.50668 0.00850)
191    POINT (-1.52484 -0.81874)
202    POINT (-0.53335 -0.41470)
213     POINT (0.37469 -0.70852)
224     POINT (-0.51154 1.40071)
235    POINT (-0.03233 -0.82224)
246     POINT (0.51597 -0.90794)
257     POINT (-0.76615 0.10036)
268    POINT (-0.02885 -0.88705)
279     POINT (-0.03222 0.26372)
28Name: col, dtype: geometry
29
30# 获取geometry列的名称
31>>> gdf.geometry.name
32'col'
33
34# 获取几何对象的类型
35>>> gdf.geom_type
360    Point
371    Point
382    Point
393    Point
404    Point
415    Point
426    Point
437    Point
448    Point
459    Point
46dtype: object
如果在构造GeoDataFrame对象时,将活动几何列的列名设置为“geometry”,系统会自动将其识别为活动几何列:
 1>>> gdf2 = gpd.GeoDataFrame({'num':range(1,len(points)+1) , 'geometry':points})
 2>>> gdf2
 3   num                   geometry
 40    1   POINT (-1.50668 0.00850)
 51    2  POINT (-1.52484 -0.81874)
 62    3  POINT (-0.53335 -0.41470)
 73    4   POINT (0.37469 -0.70852)
 84    5   POINT (-0.51154 1.40071)
 95    6  POINT (-0.03233 -0.82224)
106    7   POINT (0.51597 -0.90794)
117    8   POINT (-0.76615 0.10036)
128    9  POINT (-0.02885 -0.88705)
139   10   POINT (-0.03222 0.26372)
14
15>>> gdf2.geometry.name
16'geometry'
下面是一个使用GeoPandas自带world数据的GeoDataFrame例子。
 1# 读取数据,并显示前5行
 2>>> world = gpd.read_file(gpd.datasets.get_path("naturalearth_lowres"))
 3
 4>>> world.head()
 5       pop_est      continent  ... gdp_md_est                                           geometry
 60     889953.0        Oceania  ...       5496  MULTIPOLYGON (((180.00000 -16.06713, 180.00000...
 71   58005463.0         Africa  ...      63177  POLYGON ((33.90371 -0.95000, 34.07262 -1.05982...
 82     603253.0         Africa  ...        907  POLYGON ((-8.66559 27.65643, -8.66512 27.58948...
 93   37589262.0  North America  ...    1736425  MULTIPOLYGON (((-122.84000 49.00000, -122.9742...
104  328239523.0  North America  ...   21433226  MULTIPOLYGON (((-122.84000 49.00000, -120.0000...
11
12[5 rows x 6 columns]
13
14# 绘图
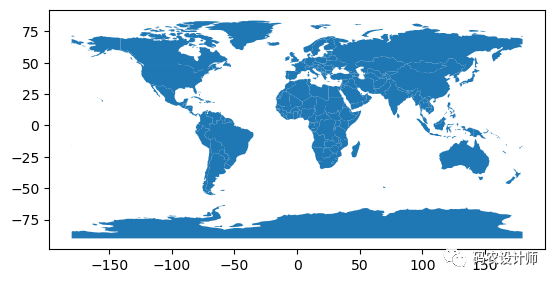
15>>> world.plot()
结果如下图所示:

目前,带有国家边界的名为“geometry”的列是活动几何列。
1>>> world.geometry.name
2'geometry'
我们也可以将这一列重命名为“borders”。
 1>>> world = world.rename(columns={'geometry':'borders'}).set_geometry('borders')
 2>>> world.head()
 3       pop_est      continent  ... gdp_md_est                                            borders
 40     889953.0        Oceania  ...       5496  MULTIPOLYGON (((180.00000 -16.06713, 180.00000...
 51   58005463.0         Africa  ...      63177  POLYGON ((33.90371 -0.95000, 34.07262 -1.05982...
 62     603253.0         Africa  ...        907  POLYGON ((-8.66559 27.65643, -8.66512 27.58948...
 73   37589262.0  North America  ...    1736425  MULTIPOLYGON (((-122.84000 49.00000, -122.9742...
 84  328239523.0  North America  ...   21433226  MULTIPOLYGON (((-122.84000 49.00000, -120.0000...
 9
10[5 rows x 6 columns]
需要注意的是:GeoDataFrame 是按名称跟踪活动几何列,因此如果重命名活动几何列,则还必须通过以下方法重置几何对象。
1gdf = gdf.rename(columns={'old_name': 'new_name'}).set_geometry('new_name')
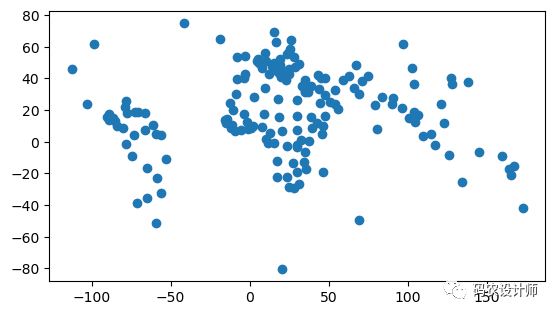
例如,,计算代表每个国家的多边形的质心,并将其设置为活动几何列。
 1>>> world['centroid_column'] = world.centroid
 2
 3>>> world = world.set_geometry('centroid_column')
 4
 5>>> world
 6         pop_est      continent  ...                                            borders              centroid_column
 70       889953.0        Oceania  ...  MULTIPOLYGON (((180.00000 -16.06713, 180.00000...  POINT (163.85316 -17.31631)
 81     58005463.0         Africa  ...  POLYGON ((33.90371 -0.95000, 34.07262 -1.05982...    POINT (34.75299 -6.25773)
 92       603253.0         Africa  ...  POLYGON ((-8.66559 27.65643, -8.66512 27.58948...   POINT (-12.13783 24.29117)
103     37589262.0  North America  ...  MULTIPOLYGON (((-122.84000 49.00000, -122.9742...   POINT (-98.14238 61.46908)
114    328239523.0  North America  ...  MULTIPOLYGON (((-122.84000 49.00000, -120.0000...  POINT (-112.59944 45.70563)
12..           ...            ...  ...                                                ...                          ...
13172    6944975.0         Europe  ...  POLYGON ((18.82982 45.90887, 18.82984 45.90888...    POINT (20.81965 44.23304)
14173     622137.0         Europe  ...  POLYGON ((20.07070 42.58863, 19.80161 42.50009...    POINT (19.28618 42.78904)
15174    1794248.0         Europe  ...  POLYGON ((20.59025 41.85541, 20.52295 42.21787...    POINT (20.89536 42.57937)
16175    1394973.0  North America  ...  POLYGON ((-61.68000 10.76000, -61.10500 10.890...   POINT (-61.33037 10.42824)
17176   11062113.0         Africa  ...  POLYGON ((30.83385 3.50917, 29.95350 4.17370, ...     POINT (30.19862 7.29289)
18
19[177 rows x 7 columns]
20
21>>> world.plot()
结果如下图所示:

需要注意的是:
默认情况下,当使用后续介绍的 read_file() 命令读取数据时,文件中的空间对象列会默认命名为“geometry”,并将被设置为活动几何列。
然而,尽管对列名和跟踪活动几何列的特殊属性的名称使用相同的术语,但它们是不同的。你可以使用 set_geometry() 命令轻松地将活动几何列移动到不同的列上。此外,gdf.geometry 将始终返回活动几何列,而不是名为“geometry”的列。
如果你希望调用名为“geometry”的列,并且另一列是活动几何列,请使用 gdf[‘geometry’],而不是 gdf.geometry。
GeoSeries 的任何属性调用或方法都可以在 GeoDataFrame 上使用。实际上,它们只是应用于“geometry”列。但是,GeoDataFrame也有一些额外的方法,这些方法会在后续进行介绍。
options属性:
GeoDataFrame有一个 options 属性,目前只有一个配置选项来控制。
 1>>> gpd.options
 2Options(
 3  display_precision: None [default: None]
 4      The precision (maximum number of decimals) of the coordinates in the
 5      WKT representation in the Series/DataFrame display. By default (None),
 6      it tries to infer and use 3 decimals for projected coordinates and 5
 7      decimals for geographic coordinates.
 8  use_pygeos: False [default: False]
 9      Whether to use PyGEOS to speed up spatial operations. The default is
10      True if PyGEOS is installed, and follows the USE_PYGEOS environment
11      variable if set.
12  )
geopandas.options.display_precision 选项可以控制在几何列的坐标显示中显示的小数位数。在上面的world示例中,默认情况下地理坐标显示 5 位小数。
1>>> world['centroid_column'].head()
20    POINT (163.85316 -17.31631)
31      POINT (34.75299 -6.25773)
42     POINT (-12.13783 24.29117)
53     POINT (-98.14238 61.46908)
64    POINT (-112.59944 45.70563)
7Name: centroid_column, dtype: geometry
如果你想改变这一点,例如想看到更多的小数,你可以这样做。
1>>> gpd.options.display_precision = 9
2>>> world['centroid_column'].head()
30    POINT (163.853164645 -17.316309426)
41      POINT (34.752989855 -6.257732429)
52     POINT (-12.137831112 24.291172960)
63     POINT (-98.142381372 61.469076145)
74    POINT (-112.599435912 45.705628002)
8Name: centroid_column, dtype: geometry


本篇文章来源于微信公众号: 码农设计师
