>>> import geopandas
>>> from geopandas import GeoSeries
>>> from shapely.geometry import Polygon
>>> p1 = Polygon([(0, 0), (1, 0), (1, 1)])
>>> p2 = Polygon([(0, 0), (1, 0), (1, 1), (0, 1)])
>>> p3 = Polygon([(2, 0), (3, 0), (3, 1), (2, 1)])
>>> g = GeoSeries([p1, p2, p3])
>>> g
0         POLYGON ((0 0, 1 0, 1 1, 0 0))
1    POLYGON ((0 0, 1 0, 1 1, 0 1, 0 0))
2    POLYGON ((2 0, 3 0, 3 1, 2 1, 2 0))
dtype: geometry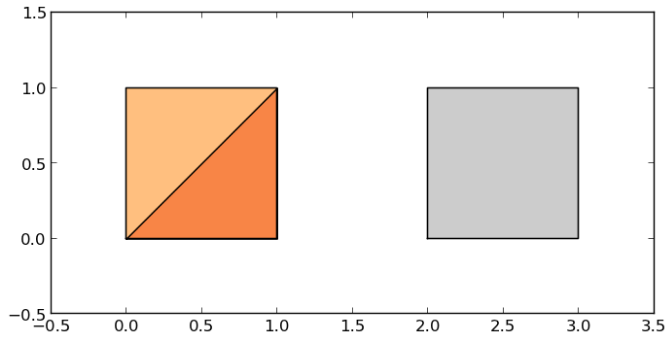
Some geographic operations return normal pandas object. The area property of a GeoSeries will return a pandas.Series containing the area of each item in the GeoSeries:
一些地理操作会返回正常的pandas对象。GeoSeries的面积属性将返回一个pandas.Series,其中包含GeoSeries中每个项目的面积。
>>> print(g.area)
0    0.5
1    1.0
2    1.0
dtype: float64
Other operations return GeoPandas objects:
其他操作返回 GeoPandas 对象:
>>> g.buffer(0.5)
0    POLYGON ((-0.3535533905932737 0.35355339059327...
1    POLYGON ((-0.5 0, -0.5 1, -0.4975923633360985 ...
2    POLYGON ((1.5 0, 1.5 1, 1.502407636663901 1.04...
dtype: geometry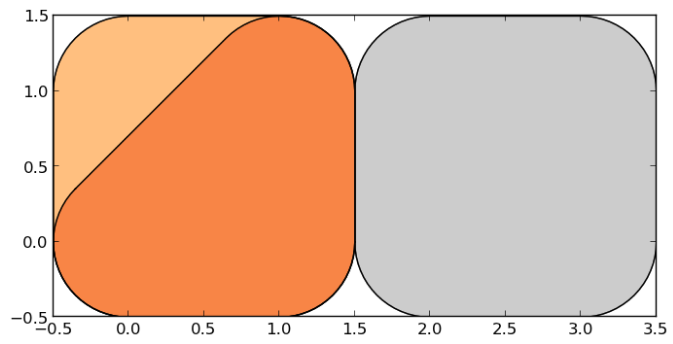
GeoPandas objects also know how to plot themselves. GeoPandas uses matplotlib for plotting. To generate a plot of our GeoSeries, use:
GeoPandas 对象也知道如何绘制它们自己。 GeoPandas 使用 matplotlib 进行绘图。要生成我们的 GeoSeries 的图,请使用:
>>> g.plot()GeoPandas also implements alternate constructors that can read any data format recognized by fiona. To read a zip file containing an ESRI shapefile with the borough boundaries of New York City (GeoPandas includes this as an example dataset):
GeoPandas还实现了备用构造函数,可以读取fiona识别的任何数据格式。读取一个包含有纽约市各区边界的ESRI形状文件的压缩文件(GeoPandas将其作为一个示例数据集)。
>>> nybb_path = geopandas.datasets.get_path('nybb')
>>> boros = geopandas.read_file(nybb_path)
>>> boros.set_index('BoroCode', inplace=True)
>>> boros.sort_index(inplace=True)
>>> boros
               BoroName     Shape_Leng    Shape_Area  \
BoroCode
1             Manhattan  359299.096471  6.364715e+08
2                 Bronx  464392.991824  1.186925e+09
3              Brooklyn  741080.523166  1.937479e+09
4                Queens  896344.047763  3.045213e+09
5         Staten Island  330470.010332  1.623820e+09

                                                   geometry
BoroCode
1         MULTIPOLYGON (((981219.0557861328 188655.31579...
2         MULTIPOLYGON (((1012821.805786133 229228.26458...
3         MULTIPOLYGON (((1021176.479003906 151374.79699...
4         MULTIPOLYGON (((1029606.076599121 156073.81420...
5         MULTIPOLYGON (((970217.0223999023 145643.33221...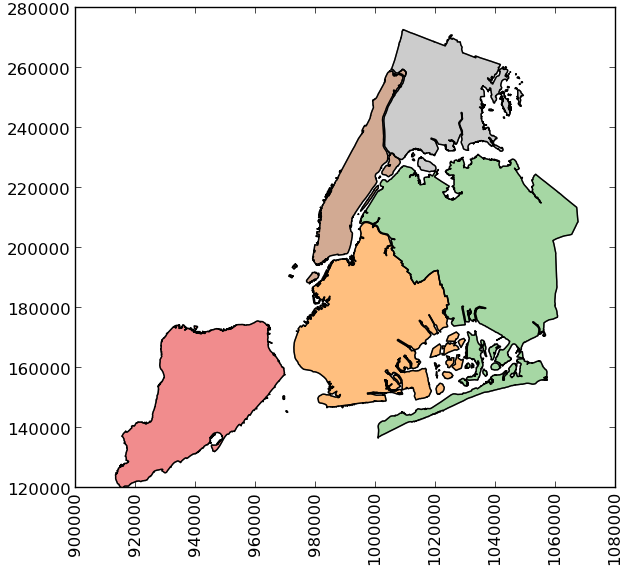
>>> boros['geometry'].convex_hull
BoroCode
1    POLYGON ((977855.4451904297 188082.3223876953,...
2    POLYGON ((1017949.977600098 225426.8845825195,...
3    POLYGON ((988872.8212280273 146772.0317993164,...
4    POLYGON ((1000721.531799316 136681.776184082, ...
5    POLYGON ((915517.6877458114 120121.8812543372,...
dtype: geometry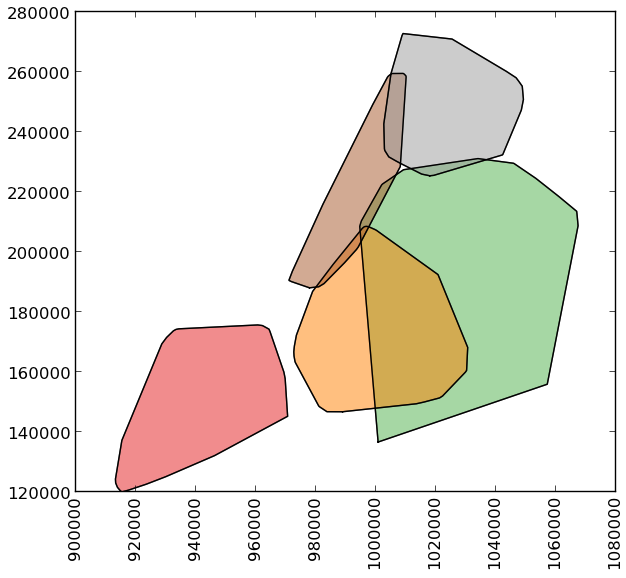
To demonstrate a more complex operation, we’ll generate a GeoSeries containing 2000 random points:
为了演示更复杂的操作,我们将生成一个包含 2000 个随机点的 GeoSeries:
>>> import numpy as np
>>> from shapely.geometry import Point
>>> xmin, xmax, ymin, ymax = 900000, 1080000, 120000, 280000
>>> xc = (xmax - xmin) * np.random.random(2000) + xmin
>>> yc = (ymax - ymin) * np.random.random(2000) + ymin
>>> pts = GeoSeries([Point(x, y) for x, y in zip(xc, yc)])
Now draw a circle with fixed radius around each point:
现在围绕每个点画一个固定半径的圆:
>>> circles = pts.buffer(2000)We can collapse these circles into a single MultiPolygon geometry with
我们可以将这些圆合并成一个单一的 MultiPolygon 几何体
>>> mp = circles.unary_unionTo extract the part of this geometry contained in each borough, we can just use:
要提取每个行政区中包含的几何图形部分,我们可以使用:
>>> holes = boros['geometry'].intersection(mp)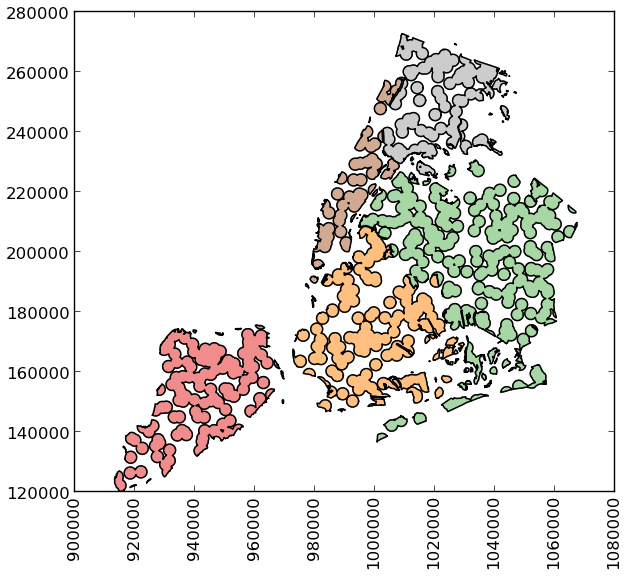
and to get the area outside of the holes:
并获得孔外的区域:
>>> boros_with_holes = boros['geometry'].difference(mp)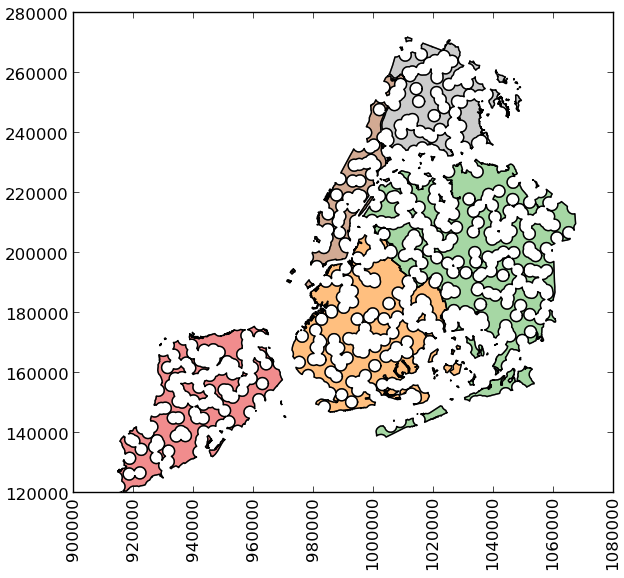
Note that this can be simplified a bit, since geometry is available as an attribute on a GeoDataFrame, and the intersection() and difference() methods are implemented with the “&” and “-” operators, respectively. For example, the latter could have been expressed simply as boros.geometry - mp.
请注意,这可以稍微简化一下,因为几何可作为 GeoDataFrame 上的一个属性使用,并且 intersection() 和 difference() 方法分别使用“&”和“-”运算符实现。例如,后者可以简单地表示为 boros.geometry – mp。
It’s easy to do things like calculate the fractional area in each borough that are in the holes:
要做的事情很简单,比如计算每个区洞的面积与区面积的比值。
>>> holes.area / boros.geometry.area
BoroCode
1    0.579939
2    0.586833
3    0.608174
4    0.582172
5    0.558075
dtype: float64