This page was generated from docs/user_guide/interactive_mapping.ipynb.
此页面生成自 docs/user_guide/interactive_mapping.ipynb.
Interactive online version: https://mybinder.org/v2/gh/geopandas/geopandas/main?urlpath=lab/tree/doc/source/docs/user_guide/interactive_mapping.ipynb
Interactive mapping
Alongside static plots, geopandas can create interactive maps based on the folium library.
除了静态图,geopandas 还可以创建基于 folium 库的交互式地图。
Creating maps for interactive exploration mirrors the API of static plots in an explore() method of a GeoSeries or GeoDataFrame.
创建用于交互式探索的地图反映了GeoSeries或GeoDataFrame的exploration()方法中静态图的API。
Loading some example data:
加载一些示例数据:
import geopandas

nybb = geopandas.read_file(geopandas.datasets.get_path('nybb'))
world = geopandas.read_file(geopandas.datasets.get_path('naturalearth_lowres'))
cities = geopandas.read_file(geopandas.datasets.get_path('naturalearth_cities'))
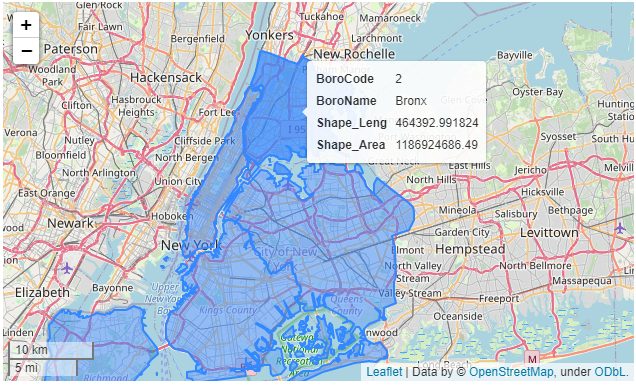
The simplest option is to use GeoDataFrame.explore():
最简单的选择是使用 GeoDataFrame.explore():
nybb.explore()
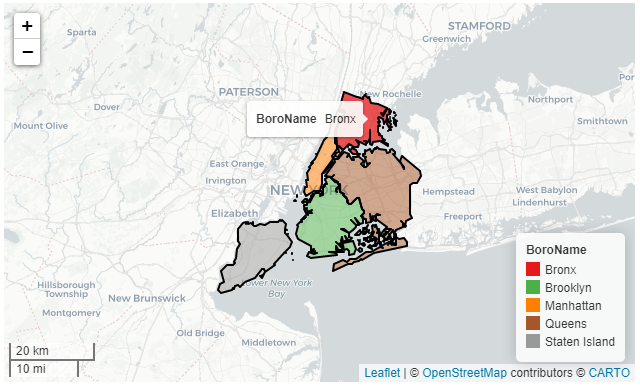
Interactive plotting offers largely the same customisation as static one plus some features on top of that. Check the code below which plots a customised choropleth map. You can use "BoroName" column with NY boroughs names as an input of the choropleth, show (only) its name in the tooltip on hover but show all values on click. You can also pass custom background tiles (either a name supported by folium, a name recognized by xyzservices.providers.query_name(), XYZ URL or xyzservices.TileProvider object), specify colormap (all supported by matplotlib) and specify black outline.
交互式绘图提供了与静态绘图大体相同的定制功能,并在此基础上增加了一些功能。请看下面的代码,它绘制了一个自定义的choropleth 地图。你可以使用 “BoroName “列,将纽约各区的名称作为一个输入,在鼠标悬停时在工具提示中(仅)显示其名称,但在点击时显示所有值。你还可以传递自定义的背景瓦片(folium支持的名称、xyzservices.providers.query_name()识别的名称、XYZ URL或xyzservices.TileProvider对象),指定colormap(全部由matplotlib支持)并指定黑色轮廓。
Note:
Note that the GeoDataFrame needs to have a CRS set if you want to use background tiles.请注意,如果要使用背景图块,GeoDataFrame 需要设置 CRS。
nybb.explore(
     column="BoroName", # make choropleth based on "BoroName" column
     tooltip="BoroName", # show "BoroName" value in tooltip (on hover)
     popup=True, # show all values in popup (on click)
     tiles="CartoDB positron", # use "CartoDB positron" tiles
     cmap="Set1", # use "Set1" matplotlib colormap
     style_kwds=dict(color="black") # use black outline
    )
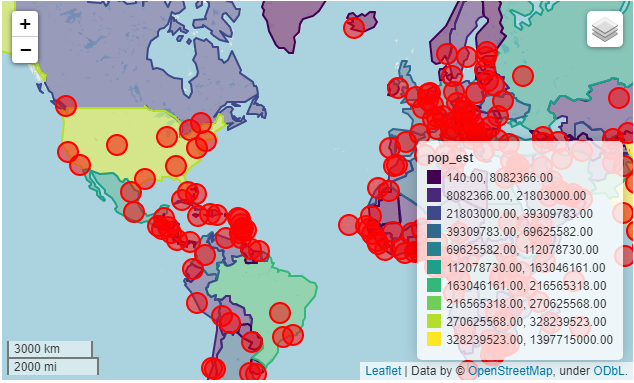
The explore() method returns a folium.Map object, which can also be passed directly (as you do with ax in plot()). You can then use folium functionality directly on the resulting map. In the example below, you can plot two GeoDataFrames on the same map and add layer control using folium. You can also add additional tiles allowing you to change the background directly in the map.
explore() 方法返回一个 folium.Map 对象,该对象也可以直接传递(就像您在 plot() 中使用 ax 一样)。然后,您可以直接在生成的地图上使用 folium 功能。在下面的示例中,您可以在同一张地图上绘制两个 GeoDataFrame,并使用 folium 添加图层控件。您还可以添加额外的图块,以便直接在地图中更改背景。
import folium

m = world.explore(
     column="pop_est",  # make choropleth based on "BoroName" column
     scheme="naturalbreaks",  # use mapclassify's natural breaks scheme
     legend=True, # show legend
     k=10, # use 10 bins
     legend_kwds=dict(colorbar=False), # do not use colorbar
     name="countries" # name of the layer in the map
)

cities.explore(
     m=m, # pass the map object
     color="red", # use red color on all points
     marker_kwds=dict(radius=10, fill=True), # make marker radius 10px with fill
     tooltip="name", # show "name" column in the tooltip
     tooltip_kwds=dict(labels=False), # do not show column label in the tooltip
     name="cities" # name of the layer in the map
)

folium.TileLayer('Stamen Toner', control=True).add_to(m)  # use folium to add alternative tiles
folium.LayerControl().add_to(m)  # use folium to add layer control

m  # show map
