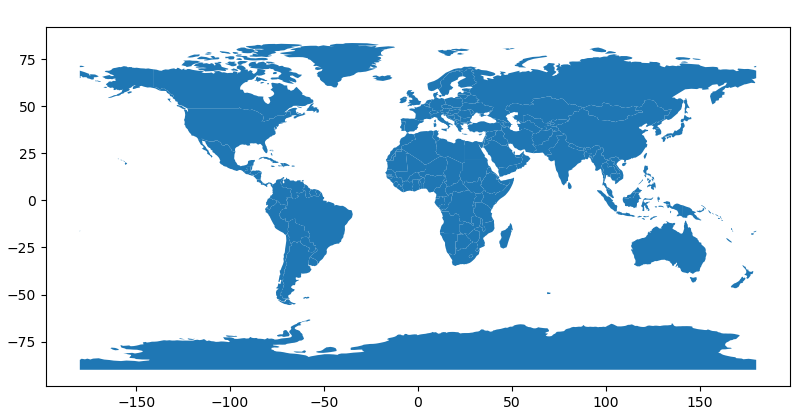
geopandas provides a high-level interface to the matplotlib library for making maps. Mapping shapes is as easy as using the plot() method on a GeoSeries or GeoDataFrame.
geopandas为matplotlib库提供了一个制作地图的高级接口。在GeoSeries或GeoDataFrame上使用plot()方法可以很容易的绘制图形。
Loading some example data:
In [1]: world = geopandas.read_file(geopandas.datasets.get_path('naturalearth_lowres'))

In [2]: cities = geopandas.read_file(geopandas.datasets.get_path('naturalearth_cities'))
We can now plot those GeoDataFrames:
# Examine country GeoDataFrame
In [3]: world.head()
Out[3]:
       pop_est  ...                                           geometry
0     889953.0  ...  MULTIPOLYGON (((180.000000000 -16.067132664, 1...
1   58005463.0  ...  POLYGON ((33.903711197 -0.950000000, 34.072620...
2     603253.0  ...  POLYGON ((-8.665589565 27.656425890, -8.665124...
3   37589262.0  ...  MULTIPOLYGON (((-122.840000000 49.000000000, -...
4  328239523.0  ...  MULTIPOLYGON (((-122.840000000 49.000000000, -...

[5 rows x 6 columns]

# Basic plot, random colors
In [4]: world.plot();
Note that in general, any options one can pass to pyplot in matplotlib (or style options that work for lines) can be passed to the plot() method.
注意,一般来说,在matplotlib中可以传递给pyplot的任何选项(或者对线条有效的样式选项)都可以传递给plot()方法。
