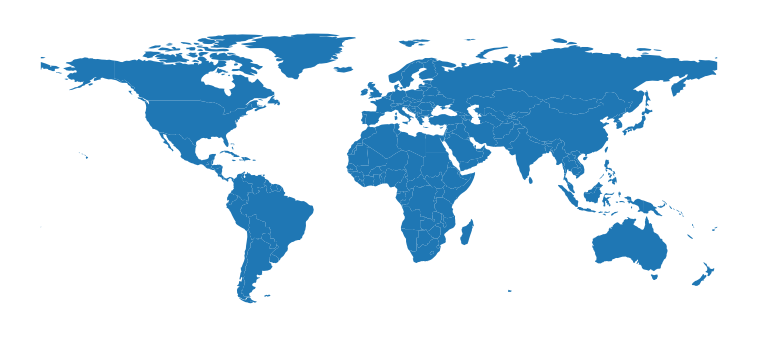
geopandas makes it easy to create Choropleth maps (maps where the color of each shape is based on the value of an associated variable). Simply use the plot command with the column argument set to the column whose values you want used to assign colors.
geopandas 可以轻松创建 Choropleth 地图(每个形状的颜色基于关联变量的值)。只需使用 plot 命令,并将列参数设置为您要使用其值分配颜色的列。
 # Plot by GDP per capita
In [5]: world = world[(world.pop_est>0) & (world.name!="Antarctica")]

In [6]: world['gdp_per_cap'] = world.gdp_md_est / world.pop_est

In [7]: world.plot(column='gdp_per_cap');
Creating a legend
When plotting a map, one can enable a legend using the legend argument:
绘制地图时,可以使用 legend 参数启用图例:
# Plot population estimates with an accurate legend
In [8]: import matplotlib.pyplot as plt

In [9]: fig, ax = plt.subplots(1, 1)

In [10]: world.plot(column='pop_est', ax=ax, legend=True)
Out[10]: <AxesSubplot: >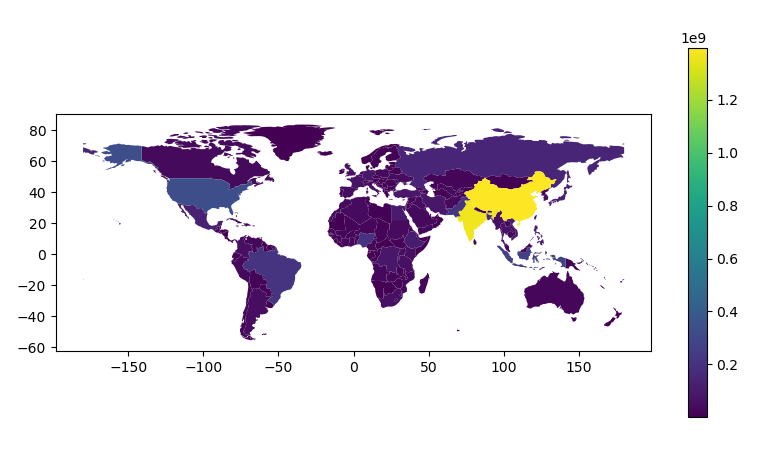
However, the default appearance of the legend and plot axes may not be desirable. One can define the plot axes (with ax) and the legend axes (with cax) and then pass those in to the plot() call. The following example uses mpl_toolkits to vertically align the plot axes and the legend axes:
但是,图例和绘图轴的默认外观可能并不理想。可以定义绘图轴(使用 ax)和图例轴(使用 cax),然后将它们传递给 plot() 调用。以下示例使用 mpl_toolkits 垂直对齐绘图轴和图例轴:
# Plot population estimates with an accurate legend
fIn [11]: rom mpl_toolkits.axes_grid1 import make_axes_locatable

In [12]: fig, ax = plt.subplots(1, 1)

In [13]: divider = make_axes_locatable(ax)

In [14]: cax = divider.append_axes("right", size="5%", pad=0.1)

In [15]: world.plot(column='pop_est', ax=ax, legend=True, cax=cax)
Out[15]: <AxesSubplot: >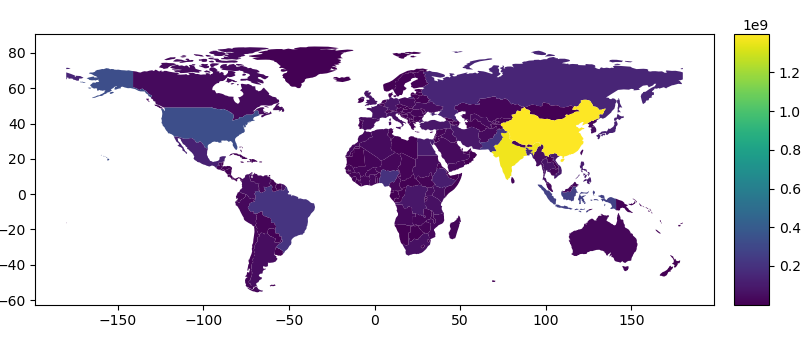
And the following example plots the color bar below the map and adds its label using legend_kwds:
以下示例在地图下方绘制颜色条并使用 legend_kwds 添加其标签:
# Plot population estimates with an accurate legend
In [16]: import matplotlib.pyplot as plt

In [17]: fig, ax = plt.subplots(1, 1)

In [18]: world.plot(column='pop_est',
           ax=ax,
           legend=True,
           legend_kwds={'label': "Population by Country",
                        'orientation': "horizontal"})

Out[18]: <AxesSubplot: >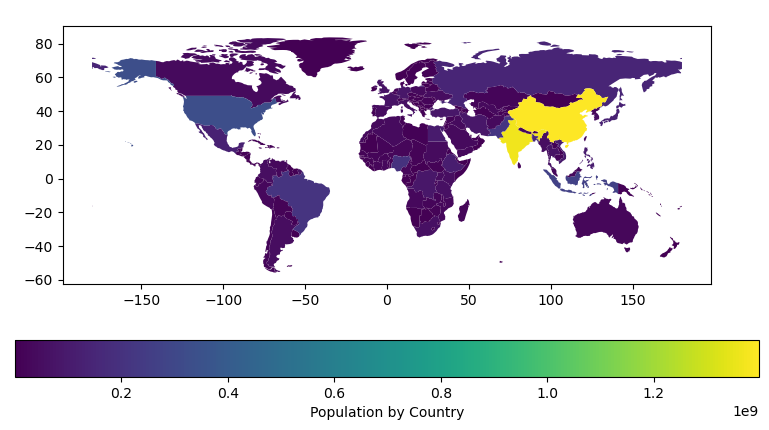
Choosing colors
One can also modify the colors used by plot() with the cmap option (for a full list of colormaps, see the matplotlib website):
还可以使用 cmap 选项修改 plot() 使用的颜色(有关颜色图的完整列表,请参阅 matplotlib 网站):
In [19]: world.plot(column='gdp_per_cap', cmap='OrRd');
To make the color transparent for when you just want to show the boundary, you have two options. One option is to do world.plot(facecolor="none", edgecolor="black"). However, this can cause a lot of confusion because "none" and None are different in the context of using facecolor and they do opposite things. None does the “default behavior” based on matplotlib, and if you use it for facecolor, it actually adds a color. The second option is to use world.boundary.plot(). This option is more explicit and clear.:
当您只想显示边界时,要使颜色透明,您有两种选择。一种选择是执行 world.plot(facecolor=”none”, edgecolor=”black”)。然而,这可能会引起很多混淆,因为“none”和 None 在使用 facecolor 的上下文中是不同的,并且它们做相反的事情。 None 没有基于 matplotlib 的“默认行为”,如果你将它用于 facecolor,它实际上会添加一种颜色。第二种选择是使用 world.boundary.plot()。这个选项更加明确和清晰。
In [20]: world.boundary.plot();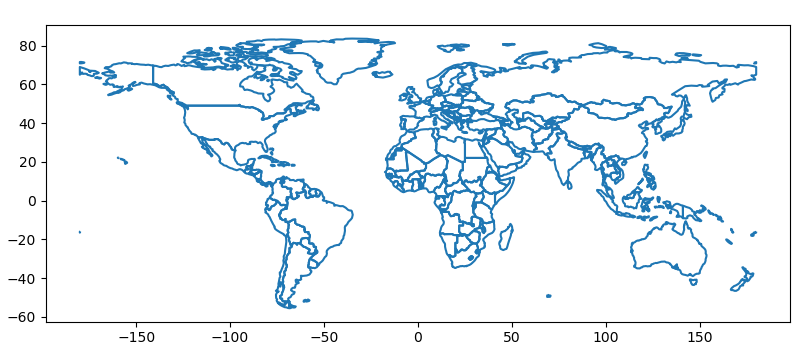
The way color maps are scaled can also be manipulated with the scheme option (if you have mapclassify installed, which can be accomplished via conda install -c conda-forge mapclassify). The scheme option can be set to any scheme provided by mapclassify (e.g. ‘box_plot’, ‘equal_interval’, ‘fisher_jenks’, ‘fisher_jenks_sampled’, ‘headtail_breaks’, ‘jenks_caspall’, ‘jenks_caspall_forced’, ‘jenks_caspall_sampled’, ‘max_p_classifier’, ‘maximum_breaks’, ‘natural_breaks’, ‘quantiles’, ‘percentiles’, ‘std_mean’ or ‘user_defined’). Arguments can be passed in classification_kwds dict. See the mapclassify documentation for further details about these map classification schemes.
颜色图的缩放方式也可以使用 scheme 选项进行操作(如果您安装了 mapclassify,维安装的话可以通过 conda install -c conda-forge mapclassify 来完成)。scheme 选项可以设置为 mapclassify 提供的任何方案(例如 ‘box_plot’、’equal_interval’、’fisher_jenks’、’fisher_jenks_sampled’、’headtail_breaks’、’jenks_caspall’、’jenks_caspall_forced’、’jenks_caspall_sampled’、’max_p_classifier’、 ‘maximum_breaks’、’natural_breaks’、’quantiles’、’percentiles’、’std_mean’ 或 ‘user_defined’)。参数可以在 classification_kwds dict 中传递。有关这些地图分类方案的更多详细信息,请参阅 mapclassify 文档。
In [21]: world.plot(column='gdp_per_cap', cmap='OrRd', scheme='quantiles');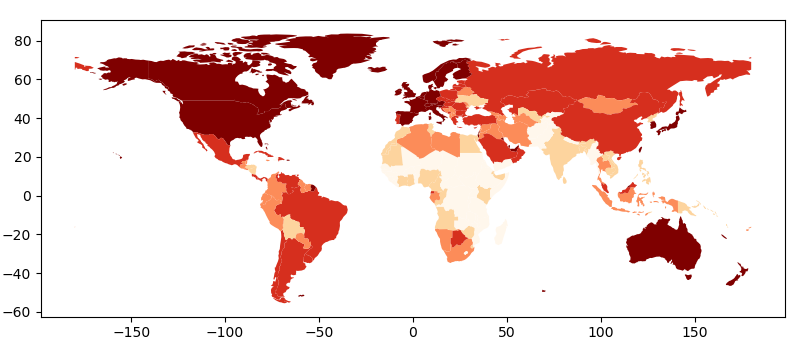
Missing data
In some cases one may want to plot data which contains missing values – for some features one simply does not know the value. Geopandas (from the version 0.7) by defaults ignores such features.
在某些情况下,人们可能想要绘制包含缺失值的数据——对于某些特征,人们根本不知道其值。 Geopandas(从 0.7 版本开始)默认忽略这些功能。
In [22]: import numpy as np

In [23]: world.loc[np.random.choice(world.index, 40), 'pop_est'] = np.nan

In [24]: world.plot(column='pop_est');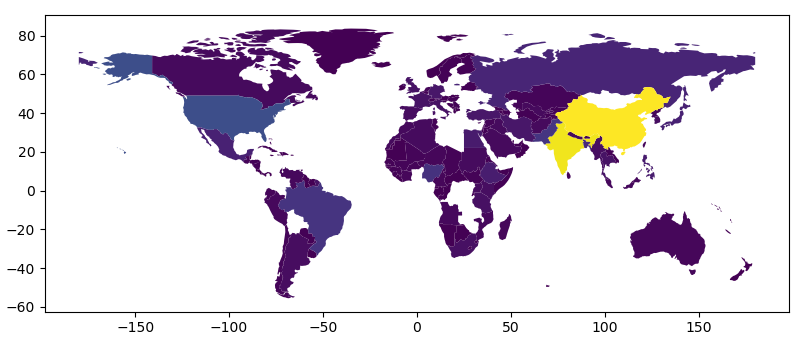
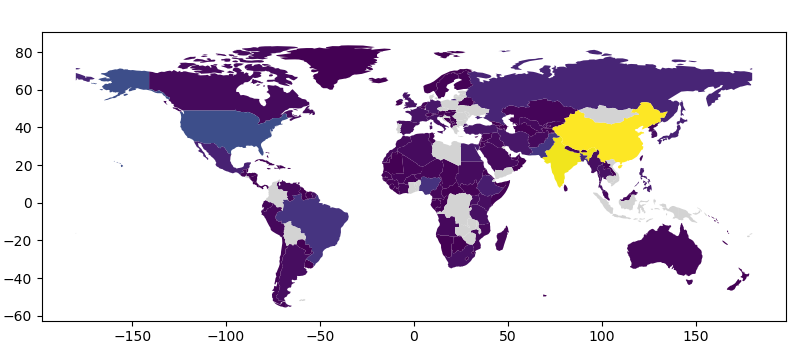
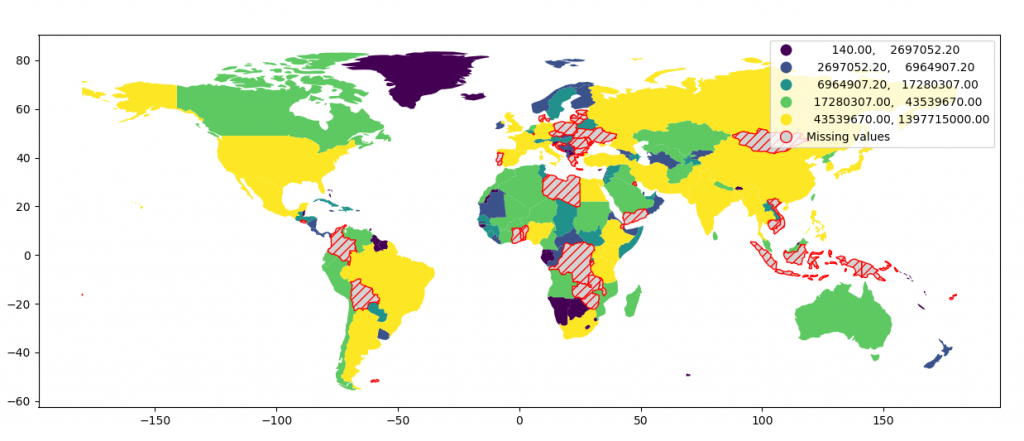
However, passing missing_kwds one can specify the style and label of features containing None or NaN.
但是,传递 missing_kwds 可以指定包含 None 或 NaN 的特征的样式和标签。
In [25]: world.plot(column='pop_est', missing_kwds={'color': 'lightgrey'});

In [26]: world.plot(
    column="pop_est",
    legend=True,
    scheme="quantiles",
    figsize=(15, 10),
    missing_kwds={
        "color": "lightgrey",
        "edgecolor": "red",
        "hatch": "///",
        "label": "Missing values",
    },
);
Other map customizations
Maps usually do not have to have axis labels. You can turn them off using set_axis_off() or axis("off") axis methods.
地图通常不必有轴标签。您可以使用 set_axis_off() 或 axis(“off”) 轴方法关闭它们。
In [27]: ax = world.plot()

In [28]: ax.set_axis_off();