There are two strategies for making a map with multiple layers – one more succinct, and one that is a little more flexible.
制作多层地图有两种策略——一种更简洁,另一种更灵活。
Before combining maps, however, remember to always ensure they share a common CRS (so they will align).
然而,在组合地图之前,请记住始终确保它们共享一个共同的 CRS(以便它们对齐)。
# Look at capitals
# Note use of standard `pyplot` line style options
In [29]: cities.plot(marker='*', color='green', markersize=5);

# Check crs
In [30]: cities = cities.to_crs(world.crs)

# Now we can overlay over country outlines
# And yes, there are lots of island capitals
# apparently in the middle of the ocean!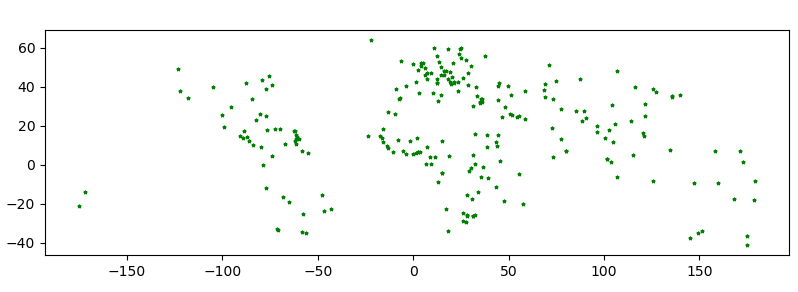
Method 1
In [31]: base = world.plot(color='white', edgecolor='black')

In [32]: cities.plot(ax=base, marker='o', color='red', markersize=5);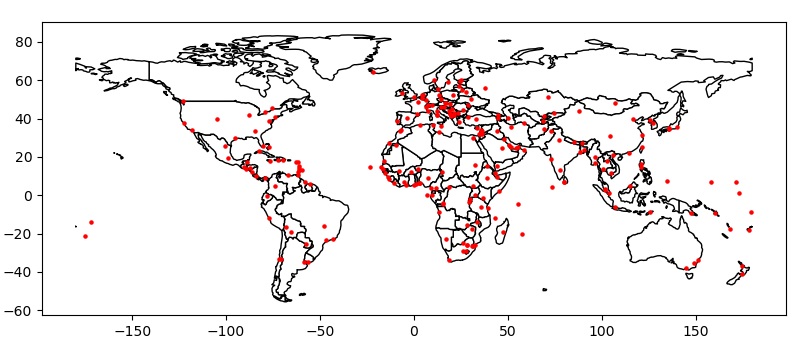
Method 2: Using matplotlib objects
In [33]: import matplotlib.pyplot as plt

In [34]: fig, ax = plt.subplots()

# set aspect to equal. This is done automatically
# when using *geopandas* plot on it's own, but not when
# working with pyplot directly.
In [35]: ax.set_aspect('equal')

In [36]: world.plot(ax=ax, color='white', edgecolor='black')
Out[36]: <AxesSubplot: >

In [37]: cities.plot(ax=ax, marker='o', color='red', markersize=5)
Out[37]: <AxesSubplot: >

In [38]: plt.show();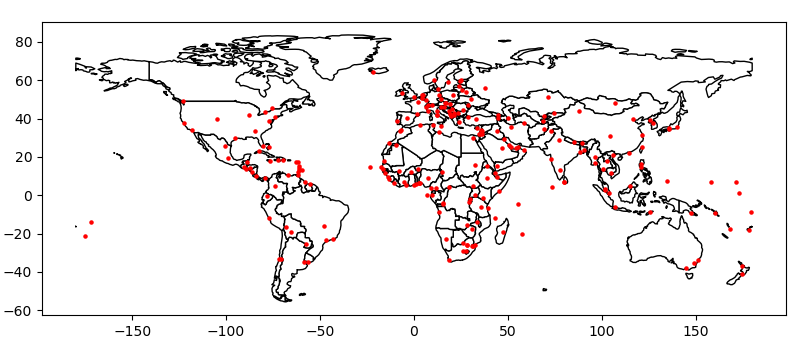
Control the order of multiple layers in a plot
When plotting multiple layers, use zorder to take control of the order of layers being plotted. The lower the zorder is, the lower the layer is on the map and vice versa.
绘制多层时,使用 zorder 来控制绘制图层的顺序。 zorder 越低,图层在地图上越处于底层,反之亦然。
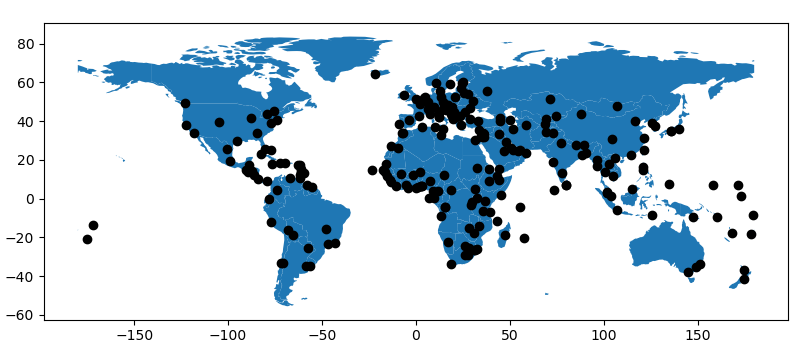
Without specified zorder, cities (Points) gets plotted below world (Polygons), following the default order based on geometry types.
如果没有指定 zorder,城市(点)将绘制在世界(多边形)下方,遵循基于几何类型的默认顺序。
In [39]: ax = cities.plot(color='k')

In [40]: world.plot(ax=ax);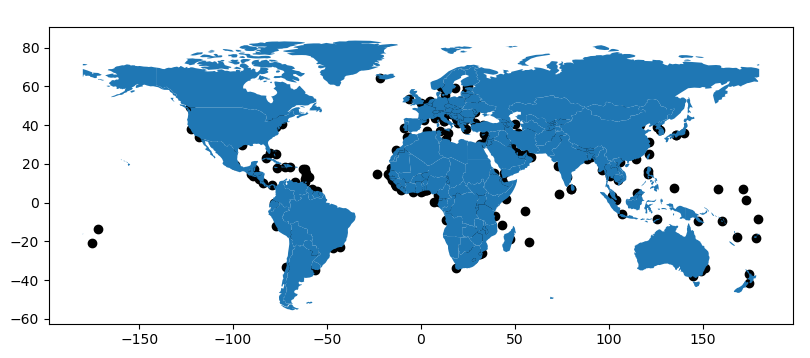
We can set the zorder for cities higher than for world to move it of top.
我们可以将城市的 zorder 设置为高于世界的 zorder 以将其移至顶部。
In [41]: ax = cities.plot(color='k', zorder=2)

In [42]: world.plot(ax=ax, zorder=1);