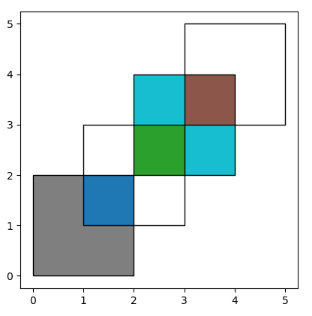
First, we create some example data:
首先,我们创建一些示例数据。
In [1]: from shapely.geometry import Polygon

In [2]: polys1 = geopandas.GeoSeries([Polygon([(0,0), (2,0), (2,2), (0,2)]),
                              Polygon([(2,2), (4,2), (4,4), (2,4)])])


In [3]: polys2 = geopandas.GeoSeries([Polygon([(1,1), (3,1), (3,3), (1,3)]),
                              Polygon([(3,3), (5,3), (5,5), (3,5)])])


In [4]: df1 = geopandas.GeoDataFrame({'geometry': polys1, 'df1':[1,2]})

In [5]: df2 = geopandas.GeoDataFrame({'geometry': polys2, 'df2':[1,2]})
These two GeoDataFrames have some overlapping areas:
这两个GeoDataFrames有一些重叠的区域。
In [6]: ax = df1.plot(color='red');
In [7]: df2.plot(ax=ax, color='green', alpha=0.5);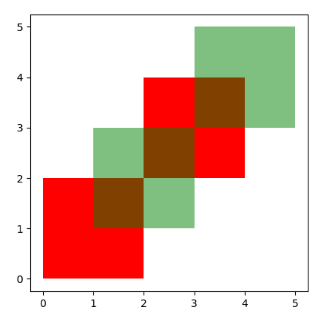
We illustrate the different overlay modes with the above example. The overlay() method will determine the set of all individual geometries from overlaying the two input GeoDataFrames. This result covers the area covered by the two input GeoDataFrames, and also preserves all unique regions defined by the combined boundaries of the two GeoDataFrames.
我们用上面的示例说明了不同的覆盖模式。overlay()方法将通过叠加两个输入的GeoDataFrames来确定所有单个几何图形的集合。该结果涵盖了两个输入GeodataFrames所覆盖的区域,同时也保留了由两个GeodataFrames的组合边界定义的所有唯一区域。
Note:
For historical reasons, the overlay method is also available as a top-level function overlay(). It is recommended to use the method as the function may be deprecated in the future.由于历史原因,overlay方法也可以作为顶层函数overlay()使用。建议使用该方法,因为该函数在未来可能会被废弃。
When using how='union', all those possible geometries are returned:
当使用how=’union’时,会返回所有这些可能的几何图形。
In [8]: res_union = df1.overlay(df2, how='union')

In [9]: res_union
Out[9]:
   df1  df2                                           geometry
0  1.0  1.0  POLYGON ((2.000000000 2.000000000, 2.000000000...
1  2.0  1.0  POLYGON ((2.000000000 2.000000000, 2.000000000...
2  2.0  2.0  POLYGON ((4.000000000 4.000000000, 4.000000000...
3  1.0  NaN  POLYGON ((2.000000000 0.000000000, 0.000000000...
4  2.0  NaN  MULTIPOLYGON (((3.000000000 3.000000000, 4.000...
5  NaN  1.0  MULTIPOLYGON (((2.000000000 2.000000000, 3.000...
6  NaN  2.0  POLYGON ((3.000000000 5.000000000, 5.000000000...

In [10]: ax = res_union.plot(alpha=0.5, cmap='tab10')

In [11]: df1.plot(ax=ax, facecolor='none', edgecolor='k');

In [12]: df2.plot(ax=ax, facecolor='none', edgecolor='k');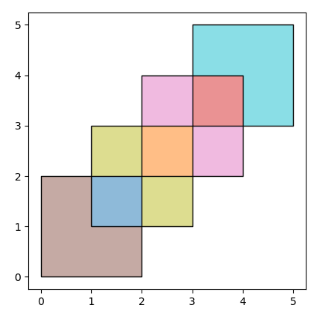
The other how operations will return different subsets of those geometries. With how='intersection', it returns only those geometries that are contained by both GeoDataFrames:
另一个操作将如何返回这些几何图形的不同子集。使用 how=’intersection’,它只返回那些被两个GeoDataFrames所包含的几何图形:
In [13]: res_intersection = df1.overlay(df2, how='intersection')

In [14]: res_intersection
Out[14]:
   df1  df2                                           geometry
0    1    1  POLYGON ((2.000000000 2.000000000, 2.000000000...
1    2    1  POLYGON ((2.000000000 2.000000000, 2.000000000...
2    2    2  POLYGON ((4.000000000 4.000000000, 4.000000000...

In [15]: ax = res_intersection.plot(cmap='tab10')

In [16]: df1.plot(ax=ax, facecolor='none', edgecolor='k');

In [17]: df2.plot(ax=ax, facecolor='none', edgecolor='k');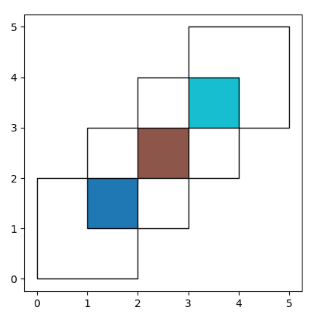
how='symmetric_difference' is the opposite of 'intersection' and returns the geometries that are only part of one of the GeoDataFrames but not of both:
how=’symmetric_difference’与’intersection’相反,返回只属于其中一个GeoDataFrames但不属于两者的几何图形。
In [18]: res_symdiff = df1.overlay(df2, how='symmetric_difference')

In [19]: res_symdiff
Out[19]:
   df1  df2                                           geometry
0  1.0  NaN  POLYGON ((2.000000000 0.000000000, 0.000000000...
1  2.0  NaN  MULTIPOLYGON (((3.000000000 3.000000000, 4.000...
2  NaN  1.0  MULTIPOLYGON (((2.000000000 2.000000000, 3.000...
3  NaN  2.0  POLYGON ((3.000000000 5.000000000, 5.000000000...

In [20]: ax = res_symdiff.plot(cmap='tab10')

In [21]: df1.plot(ax=ax, facecolor='none', edgecolor='k');

In [22]: df2.plot(ax=ax, facecolor='none', edgecolor='k');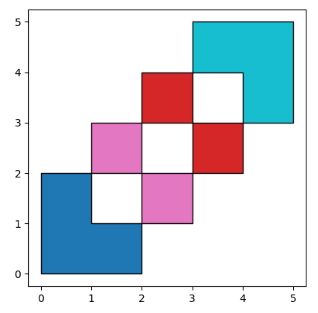
To obtain the geometries that are part of df1 but are not contained in df2, you can use how='difference':
要获取属于 df1 但不包含在 df2 中的几何图形,您可以使用 how=’difference’:
In [23]: res_difference = df1.overlay(df2, how='difference')

In [24]: res_difference
Out[24]:
                                            geometry  df1
0  POLYGON ((2.000000000 0.000000000, 0.000000000...    1
1  MULTIPOLYGON (((3.000000000 3.000000000, 4.000...    2

In [25]: ax = res_difference.plot(cmap='tab10')

In [26]: df1.plot(ax=ax, facecolor='none', edgecolor='k');

In [27]: df2.plot(ax=ax, facecolor='none', edgecolor='k');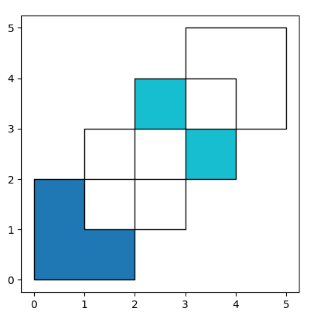
Finally, with how='identity', the result consists of the surface of df1, but with the geometries obtained from overlaying df1 with df2:
最后,在how=’identity’的情况下,结果包括df1的几何图形,但有df1与df2叠加后得到的几何图形。
In [28]: res_identity = df1.overlay(df2, how='identity')

In [29]: res_identity
Out[29]:
   df1  df2                                           geometry
0  1.0  1.0  POLYGON ((2.000000000 2.000000000, 2.000000000...
1  2.0  1.0  POLYGON ((2.000000000 2.000000000, 2.000000000...
2  2.0  2.0  POLYGON ((4.000000000 4.000000000, 4.000000000...
3  1.0  NaN  POLYGON ((2.000000000 0.000000000, 0.000000000...
4  2.0  NaN  MULTIPOLYGON (((3.000000000 3.000000000, 4.000...

In [30]: ax = res_identity.plot(cmap='tab10')

In [31]: df1.plot(ax=ax, facecolor='none', edgecolor='k');

In [32]: df2.plot(ax=ax, facecolor='none', edgecolor='k');