本系列文章是根据GeoPandas官方文档翻译整理,学习任何一个Python第三方库,其官方文档都是最好的学习资料。相比网络搜索得到的一些资料,官方文档是权威的一手资料,其内容全面、准确可靠。通过官方文档入手,能够保证学习认知不会有大偏差。在学习完官方文档后,可以在寻找其他资料进一步学习。
点击“阅读原文”或者直接访问下方链接,查看翻译整理的“GeoPandas 0.12.2 中文文档”。
https://www.mizhushare.com/docs-
可以通过百度网盘获取,需要在本地配置代码运行环境:
链接:https://pan.baidu.com/s/185Qs6RpVhyP2nm9VV39Ehw?pwd=mnsj提取码:mnsj
-
前往GitHub详情页面,单击 code 按钮,选择Download ZIP选项:
https://github.com/returu/geopandas geopandas 由 Fiona 提供支持,而 Fiona 由 GDAL 提供支持,因此可以在加载较大的数据集时利用预过滤。Bounding Box Filter:
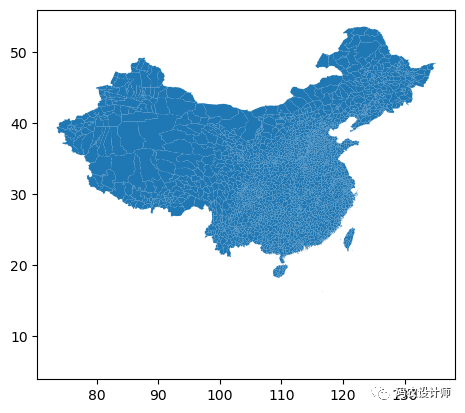
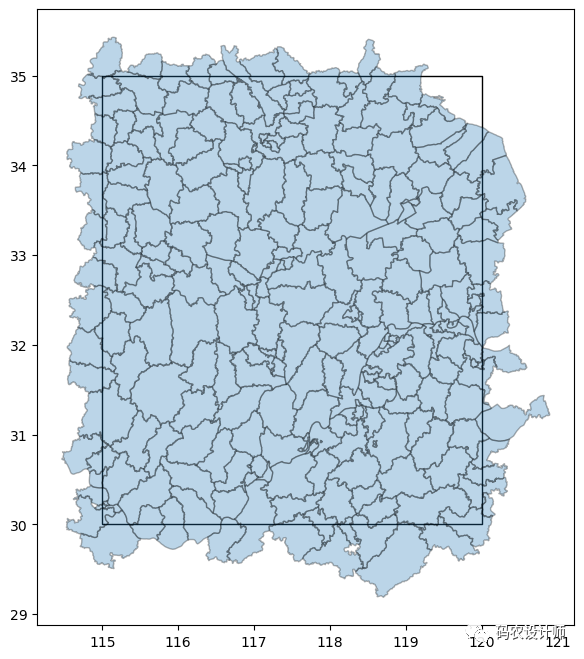
Bounding Box Filter仅加载与边界框相交的数据。其实,就是按矩形提取空间数据。1>>> gdf = gpd.read_file("./datasets/china/china_counties.shp")
2>>> gdf.plot()
-
示例1:
1# 确定边界框的范围
2>>> bbox = (115,30,120,35)
3
4>>> gdf_bbox = gpd.read_file("./datasets/china/china_counties.shp",bbox=bbox)
5
6# 绘图
7>>> ax = gpd.GeoSeries(Polygon([(115,30) , (115,35) , (120,35) , (120,30)])).plot(facecolor="none" , figsize=(8,8))
8>>> gdf_bbox.plot(ax=ax , alpha=0.3 , edgecolor="k")
-
示例2:
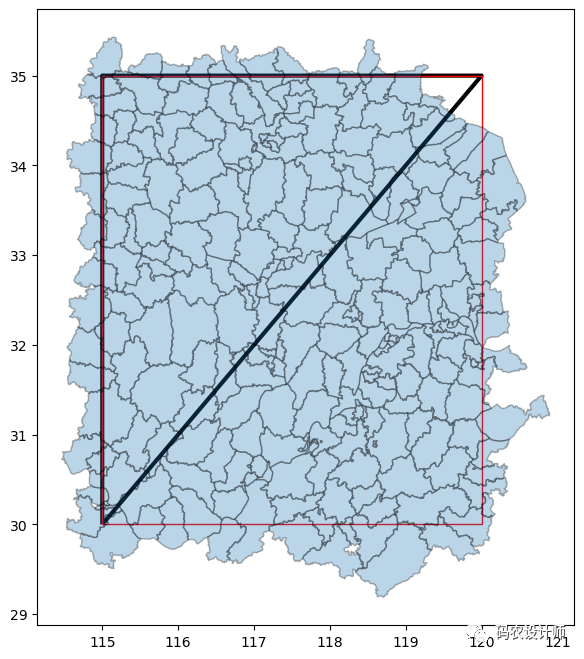
1# 将边界框设置为三角形
2>>> bbox = Polygon([(115,30) , (115,35) , (120,35)])
3
4>>> gdf_bbox = gpd.read_file("./datasets/china/china_counties.shp",bbox=bbox)
5
6
7>>> ax = gpd.GeoSeries(bbox).plot(facecolor="none" ,linewidth=3 , figsize=(8,8))
8>>> gpd.GeoSeries(Polygon([(115,30) , (115,35) , (120,35) , (120,30)])).plot(ax=ax , edgecolor="red" , facecolor="none",linewidth=1)
9>>> gdf_bbox.plot(ax=ax , alpha=0.3 , edgecolor="k")
Geometry Filter:
Geometry Filter只加载与几何图形相交的数据。其实,就是按掩膜提取空间数据。-
示例1:
将掩膜设置为矩形范围:
1# 掩膜范围
2>>> mask = Polygon([(115,30) , (115,35) , (120,35) , (120,30)])
3
4# 按掩膜提取特定范围数据
5>>> gdf_mask = gpd.read_file("./datasets/china/china_counties.shp" , mask=mask)
6
7>>> ax = gpd.GeoSeries(mask).plot(facecolor="none" , figsize=(8,8))
8>>> gdf_mask.plot(ax=ax , alpha=0.3 , edgecolor="k")
可视化结果如下图所示:

-
示例2:
将掩膜设置为三角形:
1# 掩膜范围
2>>> mask = Polygon([(115,30) , (115,35) , (120,35)])
3
4# 按掩膜提取特定范围数据
5>>> gdf_mask = gpd.read_file("./datasets/china/china_counties.shp" , mask=mask)
6
7>>> ax = gpd.GeoSeries(mask).plot(facecolor="none" , figsize=(8,8))
8>>> gdf_mask.plot(ax=ax , alpha=0.3 , edgecolor="k")
可视化结果如下图所示:
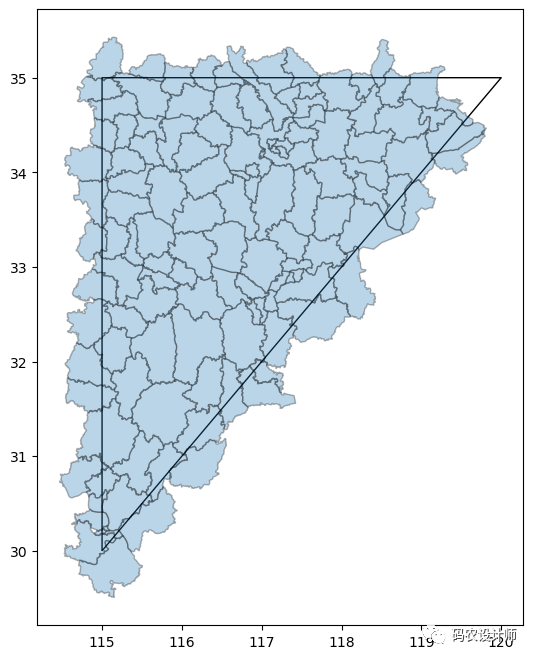
可以看到,该方法与第一种按矩形范围过滤数据有所不同。
-
示例3:
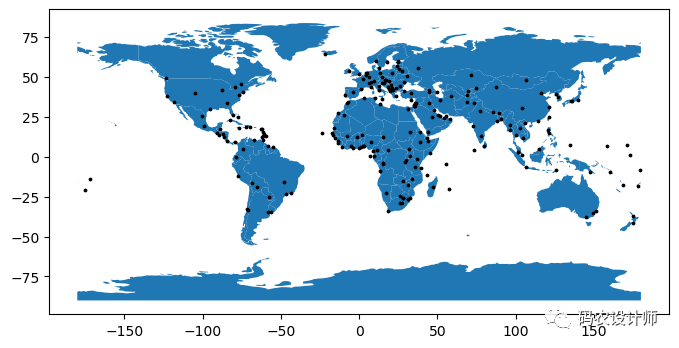
该方法还可以使用一个空间数据的过滤子集提取另一个空间数据。
以geopadans自带的world数据集为例:
1>>> gdf_1 = gpd.read_file("./datasets/naturalearth_lowres/naturalearth_lowres.shp")
2>>> gdf_2 = gpd.read_file("./datasets/naturalearth_cities/naturalearth_cities.shp")
3
4# 绘图
5>>> ax = gdf_1.plot(figsize=(8,8))
6>>> gdf_2.plot(ax=ax ,color="k" , markersize=3)
可视化结果如下图所示:
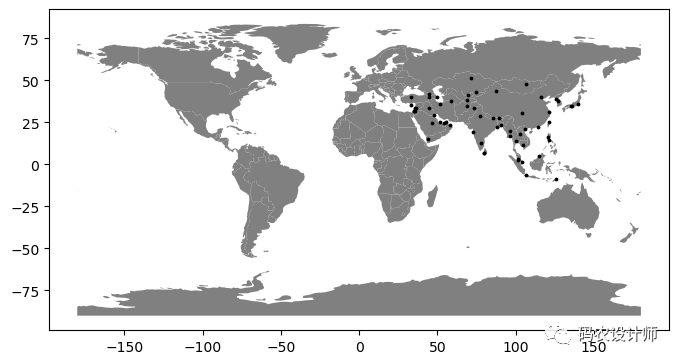
此次,将亚洲范围作为掩膜提取城市点数据:
1# 将亚洲范围作为掩膜
2>>> mask = gdf_1[gdf_1["continent"] == "Asia"]
3
4# 绘图
5>>> gdf_mask = gpd.read_file("./datasets/naturalearth_cities/naturalearth_cities.shp",mask=mask)
6>>> ax = gdf_1.plot(figsize=(8,8) , facecolor="gray")
7>>> gdf_mask.plot(ax=ax ,color="k" , markersize=3)
可视化结果如下图所示:
Row Filter:
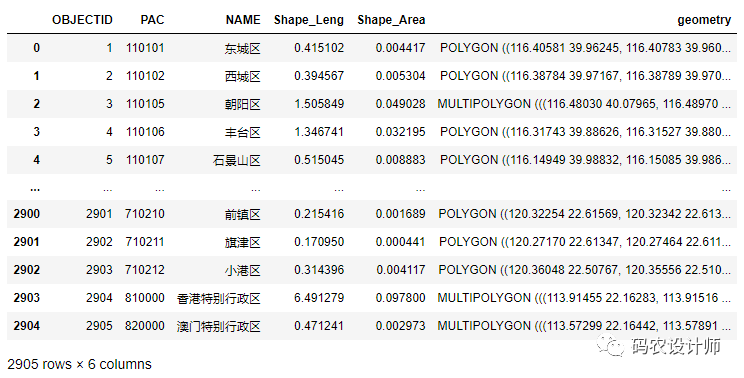
Row Filter是使用整数(对于前 n 行)或切片的方式从文件加载的行。
仍以全国县区级行政区划数据为例(包含2905行数据):
-
示例1:
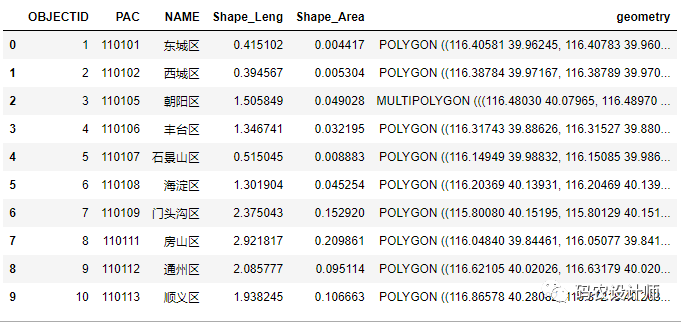
使用整数方式,加载前n行数据:
1# 加载前n行数据
2>>> gdf_row = gpd.read_file("./datasets/china/china_counties.shp" , rows=10)
3>>> gdf_row
可以看到只加载了前10行数据:
-
示例2:
使用切片对象的方式,加载指定范围数据:
1# python内置函数slice()实现切片对象
2>>> rows = slice(5,15)
3
4>>> gdf_row = gpd.read_file("./datasets/china/china_counties.shp" , rows=rows)
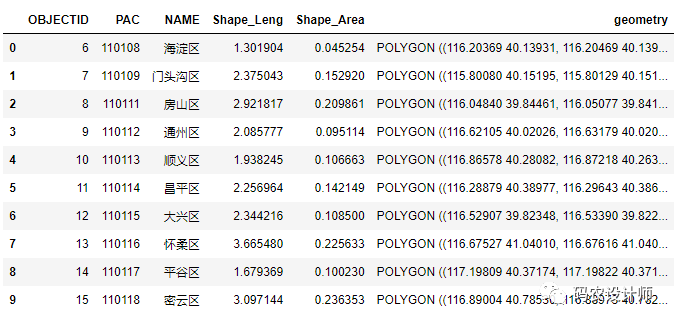
5>>> gdf_row
可以看到加载6-10行的数据:
Field/Column Filters:
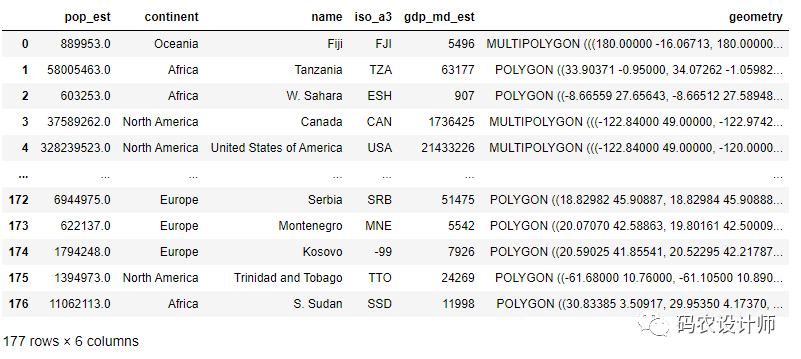
Field/Column Filters会从文件中加载指定的列:
以geopadans自带的world数据集为例(包含6列):
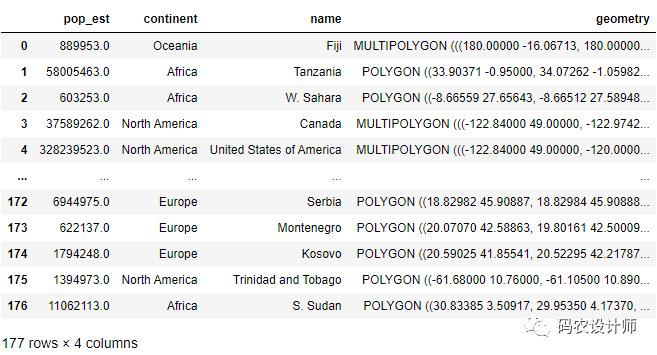
通过向include_fields参数传递指定的列名,来加载指定列:
需要注意的是该方式要求Fiona版本为1.9+。
1# Requires Fiona 1.9+
2>>> gdf_filter = gpd.read_file("./datasets/naturalearth_lowres/naturalearth_lowres.shp" , include_fields=["pop_est" , "continent" , "name"])
3>>> gdf_filter
可以看到加载了指定3列的数据(默认带活动几何列geometry列):
如果版本为1.8+,需要使用ignore_fields参数:
1# Requires Fiona 1.8+
2>>> gdf_filter = gpd.read_file("./datasets/naturalearth_lowres/naturalearth_lowres.shp" ,
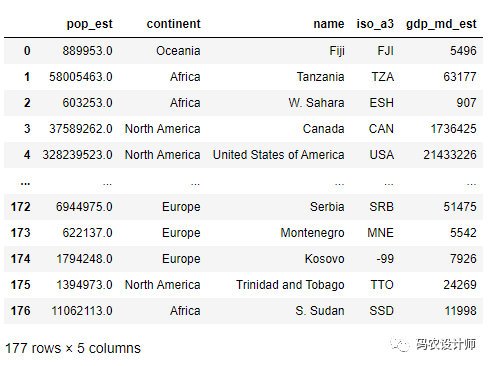
3 ignore_fields=["pop_est" , "continent" , "name"])如果不需要加载活动几何“geometry”列,通过设置ignore_geometry=True来实现,结果将返回pandas.DataFrame类型。
1>>> gdf = gpd.read_file("./datasets/naturalearth_lowres/naturalearth_lowres.shp" ,
2                    ignore_geometry=True)
3>>> gdf
可以看到未加载活动几何列:
SQL WHERE Filter:
geopandas还可以使用 SQL WHERE 语句加载数据子集(Requires Fiona 1.9+ or the pyogrio engine)。
以geopadans自带的world数据集为例,使用 SQL WHERE 语句只加载非洲的数据:
1>>> gdf_filter = gpd.read_file("./datasets/naturalearth_lowres/naturalearth_lowres.shp",
2                           where="continent='Africa'")
3>>> gdf_filter.plot()
可视化结果如下图所示:


本篇文章来源于微信公众号: 码农设计师
